Nokia 2015 Annual Report Download - page 181
Download and view the complete annual report
Please find page 181 of the 2015 Nokia annual report below. You can navigate through the pages in the report by either clicking on the pages listed below, or by using the keyword search tool below to find specific information within the annual report.-
 1
1 -
2
-
3
-
4
-
5
-
6
-
7
-
8
-
9
-
10
-
11
-
12
-
13
-
14
-
15
-
16
-
17
-
18
-
19
-
20
-
21
-
22
-
23
-
24
-
25
-
26
-
27
-
28
-
29
-
30
-
31
-
32
-
33
-
34
-
35
-
36
-
37
-
38
-
39
-
40
-
41
-
42
-
43
-
44
-
45
-
46
-
47
-
48
-
49
-
50
-
51
-
52
-
53
-
54
-
55
-
56
-
57
-
58
-
59
-
60
-
61
-
62
-
63
-
64
-
65
-
66
-
67
-
68
-
69
-
70
-
71
-
72
-
73
-
74
-
75
-
76
-
77
-
78
-
79
-
80
-
81
-
82
-
83
-
84
-
85
-
86
-
87
-
88
-
89
-
90
-
91
-
92
-
93
-
94
-
95
-
96
-
97
-
98
-
99
-
100
-
101
-
102
-
103
-
104
-
105
-
106
-
107
-
108
-
109
-
110
-
111
-
112
-
113
-
114
-
115
-
116
-
117
-
118
-
119
-
120
-
121
-
122
-
123
-
124
-
125
-
126
-
127
-
128
-
129
-
130
-
131
-
132
-
133
-
134
-
135
-
136
-
137
-
138
-
139
-
140
-
141
-
142
-
143
-
144
-
145
-
146
-
147
-
148
-
149
-
150
-
151
-
152
-
153
-
154
-
155
-
156
-
157
-
158
-
159
-
160
-
161
-
162
-
163
-
164
-
165
-
166
-
167
-
168
-
169
-
170
-
 171
171 -
 172
172 -
 173
173 -
 174
174 -
 175
175 -
 176
176 -
 177
177 -
 178
178 -
 179
179 -
 180
180 -
 181
181 -
 182
182 -
 183
183 -
 184
184 -
 185
185 -
 186
186 -
 187
187 -
 188
188 -
 189
189 -
 190
190 -
 191
191 -
192
-
193
-
194
-
195
-
196
-
197
-
198
-
199
-
200
-
201
-
202
-
203
-
204
-
205
-
206
-
207
-
208
-
209
-
210
-
211
-
212
-
213
-
214
-
215
-
216
 |
 |

179
Financial statements
NOKIA IN 2015
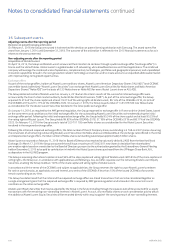
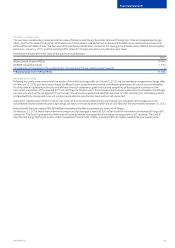
Financial credit risk
Financial instruments contain an element of risk resulting from changes in the market price due to counterparties becoming less creditworthy
orrisk of loss due to counterparties being unable to meet their obligations. Financial credit risk is measured and monitored centrally by
GroupTreasury. Financial credit risk is managed actively by limiting counterparties to a sucient number of major banks and nancial
institutions, andby monitoring the creditworthiness and the size of exposure continuously. Additionally, the Group enters into netting
arrangements with allmajor counterparties, which give the Group the right to oset in the event that the counterparty would not be able to
fulll its obligations. The Group enters into collateral agreements with certain counterparties, which require counterparties to post collateral
against derivative receivables.
Investment decisions are based on strict creditworthiness and maturity criteria as dened in the Treasury-related policies and procedures.
Asaresult of this investment policy approach and active management of outstanding investment exposures, the Group has not been subject
toany material credit losses in its nancial investments in the years presented.
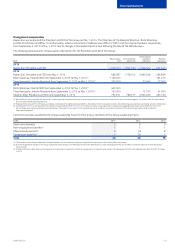
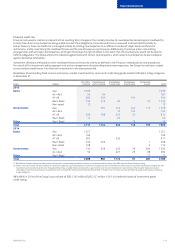
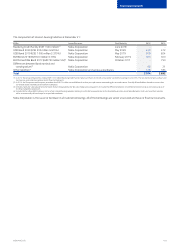
Breakdown of outstanding xed-income and money-market investments by sector and credit rating grade ranked to Moody’s rating categories
at December 31:
EURm Rating(1)
Due within
3 months
Due between 3
and 12 months
Due between
1 and 3 years
Due between
3 and 5 years
Due beyond
5 years Total(2)
2015
Banks Aaa 3 269 3 269
Aa1-Aa3 93 94 187
A1-A3 280 320 100 700
Baa1-Baa3 738 475 90 50 1 353
Non-rated 12 12
Governments Aaa 267 252 444 113 1 076
Aa1-Aa3 10 140 150
A1-A3 309 198 257 50 814
Baa1-Baa3 12 23 35
Other Baa1-Baa3 12 12
Total 4 713 1 354 632 746 163 7 608
2014
Banks Aaa 1 227 1 227
Aa1-Aa3 162 162
A1-A3 587 330 917
Baa1-Baa3 332 325 1 658
Non-rated 108 2 110
Governments Aaa 130 556 423 26 385 1 520
Aa1-Aa3 50 421 25 88 584
Other Baa1-Baa3 11 11
Total 2 596 881 1 174 51 487 5 189
(1) Bank Parent Company ratings are used here for bank groups. In some emerging markets countries, actual bank subsidiary ratings may dier from the Parent Company rating.
(2) Fixed-income and money-market investments include term deposits, structured deposits, investments in liquidity funds and investments in xed income instruments classied as available-for-sale
investments and investments at fair value through prot and loss. Liquidity funds invested solely in government securities are included under Governments. Other liquidity funds are included
underBanks. Fixed-income and money-market investments include EUR 5 million of restricted investments (EUR 11 million in 2014). These are restricted nancial assets under various contractual
orlegalobligations.
98% (98% in 2014) of the Group’s cash at bank of EUR 2 242 million (EUR 2 527 million in 2014) is held with banks of investment grade
creditrating.