Nokia 2015 Annual Report Download - page 126
Download and view the complete annual report
Please find page 126 of the 2015 Nokia annual report below. You can navigate through the pages in the report by either clicking on the pages listed below, or by using the keyword search tool below to find specific information within the annual report.-
 1
1 -
2
-
3
-
4
-
5
-
6
-
7
-
8
-
9
-
10
-
11
-
12
-
13
-
14
-
15
-
16
-
17
-
18
-
19
-
20
-
21
-
22
-
23
-
24
-
25
-
26
-
27
-
28
-
29
-
30
-
31
-
32
-
33
-
34
-
35
-
36
-
37
-
38
-
39
-
40
-
41
-
42
-
43
-
44
-
45
-
46
-
47
-
48
-
49
-
50
-
51
-
52
-
53
-
54
-
55
-
56
-
57
-
58
-
59
-
60
-
61
-
62
-
63
-
64
-
65
-
66
-
67
-
68
-
69
-
70
-
71
-
72
-
73
-
74
-
75
-
76
-
77
-
78
-
79
-
80
-
81
-
82
-
83
-
84
-
85
-
86
-
87
-
88
-
89
-
90
-
91
-
92
-
93
-
94
-
95
-
96
-
97
-
98
-
99
-
100
-
101
-
102
-
103
-
104
-
105
-
106
-
107
-
108
-
109
-
110
-
111
-
112
-
113
-
114
-
115
-
 116
116 -
 117
117 -
 118
118 -
 119
119 -
 120
120 -
 121
121 -
 122
122 -
 123
123 -
 124
124 -
 125
125 -
 126
126 -
 127
127 -
 128
128 -
 129
129 -
 130
130 -
 131
131 -
 132
132 -
 133
133 -
 134
134 -
 135
135 -
 136
136 -
137
-
138
-
139
-
140
-
141
-
142
-
143
-
144
-
145
-
146
-
147
-
148
-
149
-
150
-
151
-
152
-
153
-
154
-
155
-
156
-
157
-
158
-
159
-
160
-
161
-
162
-
163
-
164
-
165
-
166
-
167
-
168
-
169
-
170
-
171
-
172
-
173
-
174
-
175
-
176
-
177
-
178
-
179
-
180
-
181
-
182
-
183
-
184
-
185
-
186
-
187
-
188
-
189
-
190
-
191
-
192
-
193
-
194
-
195
-
196
-
197
-
198
-
199
-
200
-
201
-
202
-
203
-
204
-
205
-
206
-
207
-
208
-
209
-
210
-
211
-
212
-
213
-
214
-
215
-
216
 |
 |

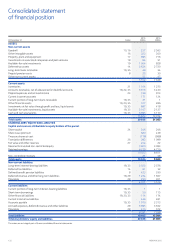
124 NOKIA IN 2015
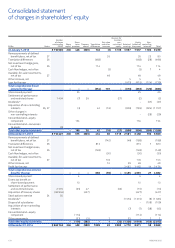
EURm Notes
Number
of shares
outstanding
(000s)
Share
capital
Share
issue
premium
Treasury
shares
Translation
differences
Fair value
and other
reserves
Reserve for
invested
non-
restricted
equity
Retained
earnings
Equity
holders of
the parent
Non-
controlling
interests Total
At January 1, 2013 3 710 985 246 446 (629) 746 (5) 3 136 3 997 7 937 1 302 9 239
Remeasurements of dened
benet plans, net of tax 27 55 55 25 80
Translation dierences 26 (468) (468) (28) (496)
Net investment hedge gains,
net of tax 26 114 114 114
Cash ow hedges, net of tax (3) (3) 7 4
Available-for-sale investments,
net of tax 27 49 49 49
Other increase, net 5 5 5
Loss for the year (615) (615) (124) (739)
Total comprehensive (loss)/
income for the year – – – (354) 101 –(610) (863) (120) (983)
Share-based payment 25 25 25
Settlement of performance
and restricted shares 1 404 (7) 26 (21) (2) (2)
Dividends(1) –(37) (37)
Acquisition of non-controlling
interests 26, 27 (3) 42 (16) (806) (783) (924) (1 707)
Other changes in
non-controlling interests –(29) (29)
Convertible bond—equity
component 154 154 154
Convertible bond—conversion
to equity 38
Total other equity movements – 169 26 42 (16) (21) (806) (606) (990) (1 596)
At December 31, 2013 3 712 427 246 615 (603) 434 80 3 115 2 581 6 468 192 6 660
Remeasurements of dened
benet plans, net of tax 27 (142) (46) (188) (188)
Translation dierences 26 813 813 7 820
Net investment hedge losses,
net of tax 26 (148) (148) (148)
Cash ow hedges, net of tax (30) (30) (30)
Available-for-sale investments,
net of tax 27 103 103 103
Other increase, net 10 39 49 49
Prot for the year 3 462 3 462 14 3 476
Total comprehensive income/
(loss) for the year – – – 665 (59) – 3 455 4 061 21 4 082
Share-based payment 4 4 4
Excess tax benet on
share-based payment 10 10 10
Settlement of performance
and restricted shares 2 570 (25) 47 (32) (10) (10)
Acquisition of treasury shares (66 904) (427) (427) (427)
Stock options exercise 24 50 – –
Dividends(1) (1 374) (1 374) (9) (1 383)
Disposal of subsidiaries –(109) (109)
Acquisition of non-controlling
interests (7) (7) (38) (45)
Convertible bond—equity
component (114) (114) (114)
Other movements (51) (5) 1 55 – 1 1
Total other equity movements –(176) (385) – 1 (32) (1 326) (1 918) (155) (2 073)
At December 31, 2014 3 648 143 246 439 (988) 1 099 22 3 083 4 710 8 611 58 8 669
Consolidated statement
of changes in shareholders’ equity