Nokia 2015 Annual Report Download - page 110
Download and view the complete annual report
Please find page 110 of the 2015 Nokia annual report below. You can navigate through the pages in the report by either clicking on the pages listed below, or by using the keyword search tool below to find specific information within the annual report.-
 1
1 -
2
-
3
-
4
-
5
-
6
-
7
-
8
-
9
-
10
-
11
-
12
-
13
-
14
-
15
-
16
-
17
-
18
-
19
-
20
-
21
-
22
-
23
-
24
-
25
-
26
-
27
-
28
-
29
-
30
-
31
-
32
-
33
-
34
-
35
-
36
-
37
-
38
-
39
-
40
-
41
-
42
-
43
-
44
-
45
-
46
-
47
-
48
-
49
-
50
-
51
-
52
-
53
-
54
-
55
-
56
-
57
-
58
-
59
-
60
-
61
-
62
-
63
-
64
-
65
-
66
-
67
-
68
-
69
-
70
-
71
-
72
-
73
-
74
-
75
-
76
-
77
-
78
-
79
-
80
-
81
-
82
-
83
-
84
-
85
-
86
-
87
-
88
-
89
-
90
-
91
-
92
-
93
-
94
-
95
-
96
-
97
-
98
-
99
-
 100
100 -
 101
101 -
 102
102 -
 103
103 -
 104
104 -
 105
105 -
 106
106 -
 107
107 -
 108
108 -
 109
109 -
 110
110 -
 111
111 -
 112
112 -
 113
113 -
 114
114 -
 115
115 -
 116
116 -
 117
117 -
 118
118 -
 119
119 -
 120
120 -
121
-
122
-
123
-
124
-
125
-
126
-
127
-
128
-
129
-
130
-
131
-
132
-
133
-
134
-
135
-
136
-
137
-
138
-
139
-
140
-
141
-
142
-
143
-
144
-
145
-
146
-
147
-
148
-
149
-
150
-
151
-
152
-
153
-
154
-
155
-
156
-
157
-
158
-
159
-
160
-
161
-
162
-
163
-
164
-
165
-
166
-
167
-
168
-
169
-
170
-
171
-
172
-
173
-
174
-
175
-
176
-
177
-
178
-
179
-
180
-
181
-
182
-
183
-
184
-
185
-
186
-
187
-
188
-
189
-
190
-
191
-
192
-
193
-
194
-
195
-
196
-
197
-
198
-
199
-
200
-
201
-
202
-
203
-
204
-
205
-
206
-
207
-
208
-
209
-
210
-
211
-
212
-
213
-
214
-
215
-
216
 |
 |

108 NOKIA IN 2015
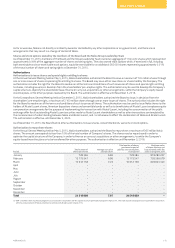
General facts on Nokia continued
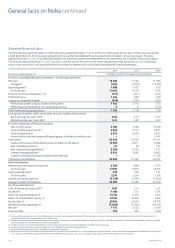
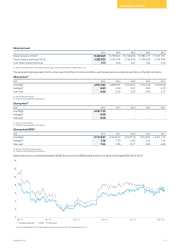
Selected nancial data
The nancial data set forth below at and for the years ended December 31, 2015 and 2014 and for each of the years in the three-year period
ended December 31, 2015 has been derived from our audited consolidated nancial statements included in this annual report. Financial
dataatDecember 31, 2013 has been derived from our historical audited consolidated nancial statements not included in this annual report.
Thenancial data at December 31, 2015 and 2014 and for each of the years in the three-year period ended December 31, 2015 should be
readin conjunction with, and are qualied in their entirety by reference to, our audited consolidated nancial statements.
For the year ended December 31
2015 2014 2013
(in EURm, except for percentage and personnel data)
From the consolidated income statement – Continuing operations
Net sales 12 499 11 762 11 795
Change % 6.3% (0.3%) (17.5%)
Operating prot 1 688 1 412 672
% of net sales 13.5% 12.0% 5.7%
Financial income and expenses, net (177) (401) (277)
Prot before tax 1 540 999 399
Income tax (expense)/benet (346) 1 719 (271)
Prot attributable to equity holders of the parent 1 192 2 710 273
Prot/ (loss) attributable to non-controlling interests 2 8 (145)
Prot from Continuing operations 1 194 2 718 128
Earnings per share (for prot attributable to equity holders of the parent)
Basic earnings per share, EUR 0.32 0.73 0.07
Diluted earnings per share, EUR 0.31 0.67 0.07
From the statement of nancial position
Non-current assets 5 102 7 339 6 048
Cash and other liquid assets(1) 9 849 7 715 8 971
Other current assets 5 975 6 009 4 825
Assets held for sale and assets of disposal groups classied as held for sale –– 5 347
Total assets 20 926 21 063 25 191
Capital and reserves attributable to equity holders of the parent 10 503 8 611 6 468
Non-controlling interests 21 58 192
Non-interest bearing liabilities(2) 8 328 9 702 7 141
Interest-bearing liabilities(3) 2 074 2 692 6 662
Liabilities of disposal groups classied as held for sale –– 4 728
Total equity and liabilities 20 926 21 063 25 191
Other information
Research and development expenses 2 126 1 948 1 970
% of net sales 17.0% 16.6% 16.7%
Capital expenditures(4) 278 254 174
% of net sales 2.2% 2.2% 1.5%
Salaries and social expenses (3 738) (3 381) (3 635)
Average number of employees 56 690 51 499 53 436
Key nancial indicators
Cash dividends per share, EUR(5) 0.26 0.14 0.37
Dividends(6) 1 488 511 1 374
Return of capital employed, % 14.1% 11.2% 5.0%
Return on shareholders' equity, % 12.5% 35.9% 3.8%
Equity ratio, % 59.0% 49.3% 28.1%
Net debt to equity (gearing), % (73.9%) (57.9%) (34.7%)
Net cash 7 775 5 023 2 309
Free cash ow 193 964 (335)
(1) Cash and other liquid assets consist of the following line items from our consolidated statement of nancial position: cash and cash equivalents, available-for-sale investments, liquid assets and
investments at fair value through prot and loss, liquid assets.
(2) Includes Deferred tax liabilities, Dened benet pension liabilities, Deferred revenue and other long-term liabilities, Provisions, Other nancial liabilities, Current income tax liabilities, Accounts payable
and Accrued expenses and deferred revenue and other liabilities.
(3) Includes Long-term interest-bearing liabilities, Current portion of long-term interest-bearing liabilities and Short-term borrowings.
(4) Includes purchases of property, plant and equipment and intangible assets for Continuing operations.
(5) Dividends declared per share in 2015 are subject to shareholders’ approval.
(6) Maximum amount to be distributed as dividends based on the number of shares at March 31, 2016, excluding the number of treasury shares, and based on the proposal by the Board for the scal year
2015, subject to shareholders approval at the Annual General Meeting convening on June 16, 2016. Previous year’s gure represents the total actual amounts paid.