Nokia 2015 Annual Report Download - page 200
Download and view the complete annual report
Please find page 200 of the 2015 Nokia annual report below. You can navigate through the pages in the report by either clicking on the pages listed below, or by using the keyword search tool below to find specific information within the annual report.-
 1
1 -
2
-
3
-
4
-
5
-
6
-
7
-
8
-
9
-
10
-
11
-
12
-
13
-
14
-
15
-
16
-
17
-
18
-
19
-
20
-
21
-
22
-
23
-
24
-
25
-
26
-
27
-
28
-
29
-
30
-
31
-
32
-
33
-
34
-
35
-
36
-
37
-
38
-
39
-
40
-
41
-
42
-
43
-
44
-
45
-
46
-
47
-
48
-
49
-
50
-
51
-
52
-
53
-
54
-
55
-
56
-
57
-
58
-
59
-
60
-
61
-
62
-
63
-
64
-
65
-
66
-
67
-
68
-
69
-
70
-
71
-
72
-
73
-
74
-
75
-
76
-
77
-
78
-
79
-
80
-
81
-
82
-
83
-
84
-
85
-
86
-
87
-
88
-
89
-
90
-
91
-
92
-
93
-
94
-
95
-
96
-
97
-
98
-
99
-
100
-
101
-
102
-
103
-
104
-
105
-
106
-
107
-
108
-
109
-
110
-
111
-
112
-
113
-
114
-
115
-
116
-
117
-
118
-
119
-
120
-
121
-
122
-
123
-
124
-
125
-
126
-
127
-
128
-
129
-
130
-
131
-
132
-
133
-
134
-
135
-
136
-
137
-
138
-
139
-
140
-
141
-
142
-
143
-
144
-
145
-
146
-
147
-
148
-
149
-
150
-
151
-
152
-
153
-
154
-
155
-
156
-
157
-
158
-
159
-
160
-
161
-
162
-
163
-
164
-
165
-
166
-
167
-
168
-
169
-
170
-
171
-
172
-
173
-
174
-
175
-
176
-
177
-
178
-
179
-
180
-
181
-
182
-
183
-
184
-
185
-
186
-
187
-
188
-
189
-
 190
190 -
 191
191 -
 192
192 -
 193
193 -
 194
194 -
 195
195 -
 196
196 -
 197
197 -
 198
198 -
 199
199 -
 200
200 -
 201
201 -
 202
202 -
 203
203 -
 204
204 -
 205
205 -
 206
206 -
 207
207 -
 208
208 -
 209
209 -
 210
210 -
211
-
212
-
213
-
214
-
215
-
216
 |
 |

198 NOKIA IN 2015
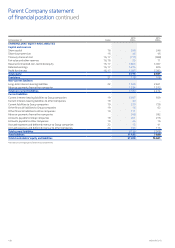
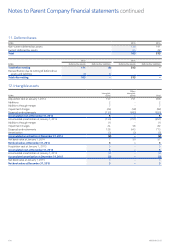
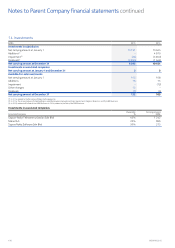
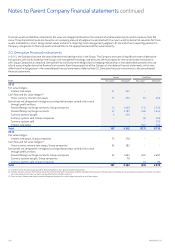
17. Distributable earnings
EURm 2015 2014
Reserve for invested non-restricted equity 3 805 3 067
Retained earnings 5 275 826
Prot for the year 1 087 5 383
Total retained earnings 10 167 9 276
Treasury shares at cost (711) (988)
Total 9 456 8 288
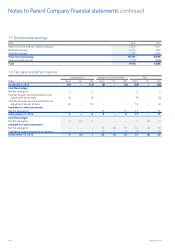
18. Fair value and other reserves
EURm
Hedging reserve Available-for-sale investments Total
Gross Tax Net Gross Tax Net Gross Tax Net
At January 1, 2014 (17) –(17) (2) –(2) (19) –(19)
Cash ow hedges:
Net fair value gains 3 – 3 – – 3 – 3
Transfer of gains to income statement as
adjustment to net sales (2) –(2) – – – (2) –(2)
Transfer of losses to income statement as
adjustment to cost of sales 18 –18 – – – 18 –18
Available-for-sale investments:
Net fair value gains – – – 11 –11 11 –11
At December 31, 2014 2 – 2 9 – 9 11 –11
Cash ow hedges:
Net fair value gains 7 (2) 5 – – – 7 (2) 5
Available-for-sale investments:
Net fair value gains – – – 14 (4) 10 14 (4) 10
Transfer to income statement on disposal – – – (1) –(1) (1) –(1)
At December 31, 2015 9 (2) 7 22 (4) 18 31 (6) 25
Notes to Parent Company nancial statements continued