Nokia 2015 Annual Report Download - page 141
Download and view the complete annual report
Please find page 141 of the 2015 Nokia annual report below. You can navigate through the pages in the report by either clicking on the pages listed below, or by using the keyword search tool below to find specific information within the annual report.-
 1
1 -
2
-
3
-
4
-
5
-
6
-
7
-
8
-
9
-
10
-
11
-
12
-
13
-
14
-
15
-
16
-
17
-
18
-
19
-
20
-
21
-
22
-
23
-
24
-
25
-
26
-
27
-
28
-
29
-
30
-
31
-
32
-
33
-
34
-
35
-
36
-
37
-
38
-
39
-
40
-
41
-
42
-
43
-
44
-
45
-
46
-
47
-
48
-
49
-
50
-
51
-
52
-
53
-
54
-
55
-
56
-
57
-
58
-
59
-
60
-
61
-
62
-
63
-
64
-
65
-
66
-
67
-
68
-
69
-
70
-
71
-
72
-
73
-
74
-
75
-
76
-
77
-
78
-
79
-
80
-
81
-
82
-
83
-
84
-
85
-
86
-
87
-
88
-
89
-
90
-
91
-
92
-
93
-
94
-
95
-
96
-
97
-
98
-
99
-
100
-
101
-
102
-
103
-
104
-
105
-
106
-
107
-
108
-
109
-
110
-
111
-
112
-
113
-
114
-
115
-
116
-
117
-
118
-
119
-
120
-
121
-
122
-
123
-
124
-
125
-
126
-
127
-
128
-
129
-
130
-
 131
131 -
 132
132 -
 133
133 -
 134
134 -
 135
135 -
 136
136 -
 137
137 -
 138
138 -
 139
139 -
 140
140 -
 141
141 -
 142
142 -
 143
143 -
 144
144 -
 145
145 -
 146
146 -
 147
147 -
 148
148 -
 149
149 -
 150
150 -
 151
151 -
152
-
153
-
154
-
155
-
156
-
157
-
158
-
159
-
160
-
161
-
162
-
163
-
164
-
165
-
166
-
167
-
168
-
169
-
170
-
171
-
172
-
173
-
174
-
175
-
176
-
177
-
178
-
179
-
180
-
181
-
182
-
183
-
184
-
185
-
186
-
187
-
188
-
189
-
190
-
191
-
192
-
193
-
194
-
195
-
196
-
197
-
198
-
199
-
200
-
201
-
202
-
203
-
204
-
205
-
206
-
207
-
208
-
209
-
210
-
211
-
212
-
213
-
214
-
215
-
216
 |
 |

139
Financial statements
NOKIA IN 2015
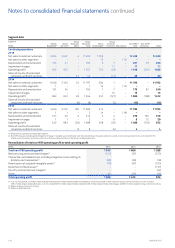
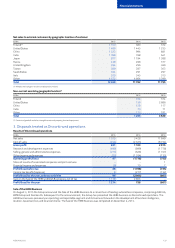
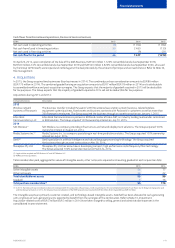
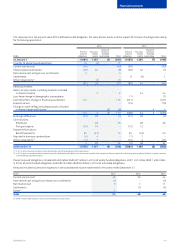
Cash ows from Discontinued operations, HERE business
EURm 2015 2014 2013
Net cash from operating activities 12 106 62
Net cash from/(used in) investing activities 2 503 (104) (39)
Net cash ow for the period 2 515 223
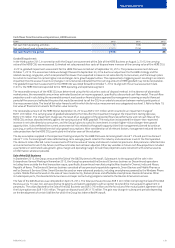
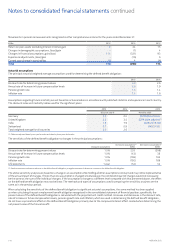
Goodwill impairment
In the third quarter 2015, in connection with the Group’s announcement of the Sale of the HERE Business on August 3, 2015, the carrying
valueof the HERE CGU was reassessed. Estimated net sale proceeds less costs of disposal were in excess of the carrying value of the HERE CGU.
In 2014, goodwill impairment assessment for the HERE CGU was carried out at September 30, 2014. The previous assessment date was
October 1, 2013. The assessment date was brought forward to September 30, 2014 due to an adjustment to the HERE strategy and the
relatednew long-range plan, which incorporated the slower-than-expected increase in net sales directly to consumers, and the Group’s plans
tocurtail its investment in certain higher-risk and longer-term growth opportunities. This represented a triggering event resulting in an interim
impairment test to assess if events or changes in circumstances indicated that the carrying amount of HERE goodwill may not be recoverable.
Thegoodwill impairment assessment for the HERE CGU was rolled forward to October 1, 2014 to align with the annual assessment date.
In2014, the HERE CGU corresponded to the HERE operating and reportable segment.
The recoverable amount of the HERE CGU was determined using the fair value less costs of disposal method. In the absence of observable
market prices, the recoverable amount was estimated based on an income approach, specically a discounted cash ow model. The cash ow
projection used in calculating the recoverable amount was based on nancial plans approved by management covering an explicit forecast
period of ve years and reected the price that would be received to sell the CGU in an orderly transaction between market participants at
themeasurement date. The level of fair value hierarchy within which the fair value measurement was categorized was level 3. Refer to Note 19,
Fairvalue of nancial instruments for the fair value hierarchy.
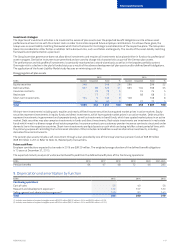
The recoverable amount of the HERE CGU at September 30, 2014 was EUR 2 031 million, which resulted in an impairment charge of
EUR 1 209 million. The carrying value of goodwill allocated to the CGU after the impairment charge at the impairment testing date was
EUR 2 273 million. The impairment charge was the result of an evaluation of the projected nancial performance and net cash ows of the
HERECGU and was allocated entirely against the carrying value of HERE goodwill. The evaluation incorporated the slower-than-expected
increase innet sales directly to consumers, and the Group’s plans to curtail its investment in certain higher-risk and longer-term growth
opportunities. Italso reected the current assessment of risks related to the growth opportunities that management planned to continue
pursuing, as well as the related terminal value growth assumptions. After consideration of all relevant factors, management reduced the net
sales projections for the HERE CGU, particularly in the latter years of the valuation.
The key assumptions applied in the impairment testing analysis for the HERE CGU were terminal growth rate of 1.2% and post-tax discount
rateof 11.0%. Terminal growth rates reected long-term average growth rates for the industry and economies in which the CGU operated.
Thediscount rates reected current assessments of the time value of money and relevant market risk premiums. Risk premiums reected risks
anduncertainties for which the future cash ow estimates had not been adjusted. Other key variables in future cash ow projections included
assumptions on estimated sales growth, gross margin and operating margin. All cash ow projections were consistent with external sources
ofinformation, wherever possible.
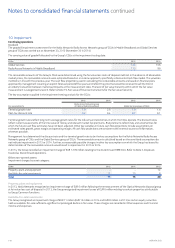
Sale of the D&S Business
In September 2013, the Group announced the Sale of the D&S Business to Microsoft. Subsequent to the approval of the sale in the
Extraordinary General Meeting in November 2013, the Group has presented the Devices & Services business as Discontinued operations
including items outside the nal transaction scope; specically, discontinued manufacturing facilities located in Chennai, India and Masan,
Republic of Korea. The Devices & Services business consisted of two previously reportable segments, Smart Devices and Mobile Phones as
wellas Devices & Services Other. Smart Devices focused on more advanced products, including smartphones powered by the Windows Phone
system. Mobile Phones focused on the area of mass market entry, feature phones and aordable smartphones. Devices & Services Other
included spare parts, the divested Vertu business and major restructuring programs related to the Devices & Services business.
The Sale of the D&S Business was completed on April 25, 2014. The total purchase price was EUR 5 440 million comprising the Sale of the D&S
Business and a 10-year non-exclusive license to patents and patent applications with an option to extend the mutual patent agreement in
perpetuity. The value allocated to the Sale of the D&S Business was EUR 3 790 million and the fair value of the mutual patent agreement and
thefuture option was EUR 1 650 million. The gain on disposal was EUR 3 175 million. The gain may change in subsequent periods depending
onthe development of certain liabilities for which the Group has indemnied Microsoft.