Nokia 2015 Annual Report Download - page 113
Download and view the complete annual report
Please find page 113 of the 2015 Nokia annual report below. You can navigate through the pages in the report by either clicking on the pages listed below, or by using the keyword search tool below to find specific information within the annual report.-
 1
1 -
2
-
3
-
4
-
5
-
6
-
7
-
8
-
9
-
10
-
11
-
12
-
13
-
14
-
15
-
16
-
17
-
18
-
19
-
20
-
21
-
22
-
23
-
24
-
25
-
26
-
27
-
28
-
29
-
30
-
31
-
32
-
33
-
34
-
35
-
36
-
37
-
38
-
39
-
40
-
41
-
42
-
43
-
44
-
45
-
46
-
47
-
48
-
49
-
50
-
51
-
52
-
53
-
54
-
55
-
56
-
57
-
58
-
59
-
60
-
61
-
62
-
63
-
64
-
65
-
66
-
67
-
68
-
69
-
70
-
71
-
72
-
73
-
74
-
75
-
76
-
77
-
78
-
79
-
80
-
81
-
82
-
83
-
84
-
85
-
86
-
87
-
88
-
89
-
90
-
91
-
92
-
93
-
94
-
95
-
96
-
97
-
98
-
99
-
100
-
101
-
102
-
 103
103 -
 104
104 -
 105
105 -
 106
106 -
 107
107 -
 108
108 -
 109
109 -
 110
110 -
 111
111 -
 112
112 -
 113
113 -
 114
114 -
 115
115 -
 116
116 -
 117
117 -
 118
118 -
 119
119 -
 120
120 -
 121
121 -
 122
122 -
 123
123 -
124
-
125
-
126
-
127
-
128
-
129
-
130
-
131
-
132
-
133
-
134
-
135
-
136
-
137
-
138
-
139
-
140
-
141
-
142
-
143
-
144
-
145
-
146
-
147
-
148
-
149
-
150
-
151
-
152
-
153
-
154
-
155
-
156
-
157
-
158
-
159
-
160
-
161
-
162
-
163
-
164
-
165
-
166
-
167
-
168
-
169
-
170
-
171
-
172
-
173
-
174
-
175
-
176
-
177
-
178
-
179
-
180
-
181
-
182
-
183
-
184
-
185
-
186
-
187
-
188
-
189
-
190
-
191
-
192
-
193
-
194
-
195
-
196
-
197
-
198
-
199
-
200
-
201
-
202
-
203
-
204
-
205
-
206
-
207
-
208
-
209
-
210
-
211
-
212
-
213
-
214
-
215
-
216
 |
 |
111
General facts on Nokia
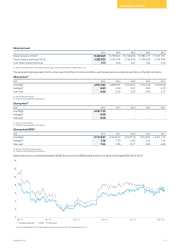
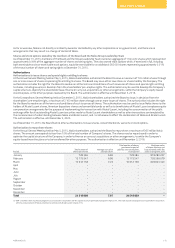
NOKIA IN 2015
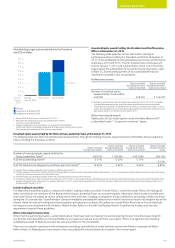
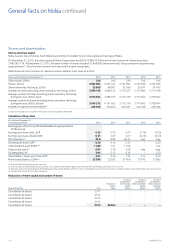
Share turnover
2015 2014 2013 2012 2011
Share turnover (000s)(1) 8 490 455 9 278 853 16 748 295 19 995 211 15 651 671
Total number of shares (000s) 3 992 823 3 745 044 3 744 956 3 744 956 3 744 956
% of total number of shares 213 248 447 534 418
(1) Source: Nasdaq Helsinki, the NYSE composite tape and Euronext Paris (since November 2015).
The principal trading markets for the shares are the NYSE, in the form of ADSs, and Nasdaq Helsinki and Euronext Paris, in the form of shares.
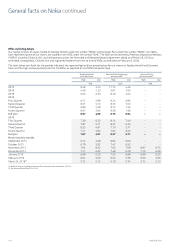
Share prices(1)
EUR 2015 2014 2013 2012 2011
Low/high 4.91/7.87 4.89/6.97 2.30/6.03 1.33/4.46 3.33/8.48
Average(2) 6.53 5.99 3.57 2.62 5.19
Year-end 6.60 6.56 5.82 2.93 3.77
(1) Source: Nasdaq Helsinki.
(2) Total turnover divided by total volume.
Share prices(1)
EUR 2015 2014 2013 2012 2011
Low/high 6.29/7.15 ––––
Average(2) 6.66 – – – –
Year-end 6.59 – – – –
(1) Source: Euronext Paris.
(2) Total turnover divided by total volume.
Share prices (ADS)(1)
USD 2015 2014 2013 2012 2011
Low/high 5.71/8.37 6.64/8.73 3.02/8.18 1.63/5.87 4.46/11.75
Average(2) 7.28 7.79 4.82 3.41 7.14
Year-end 7.02 7.86 8.11 3.95 4.82
(1) Source: The NYSE composite tape.
(2) Total turnover divided by total volume.
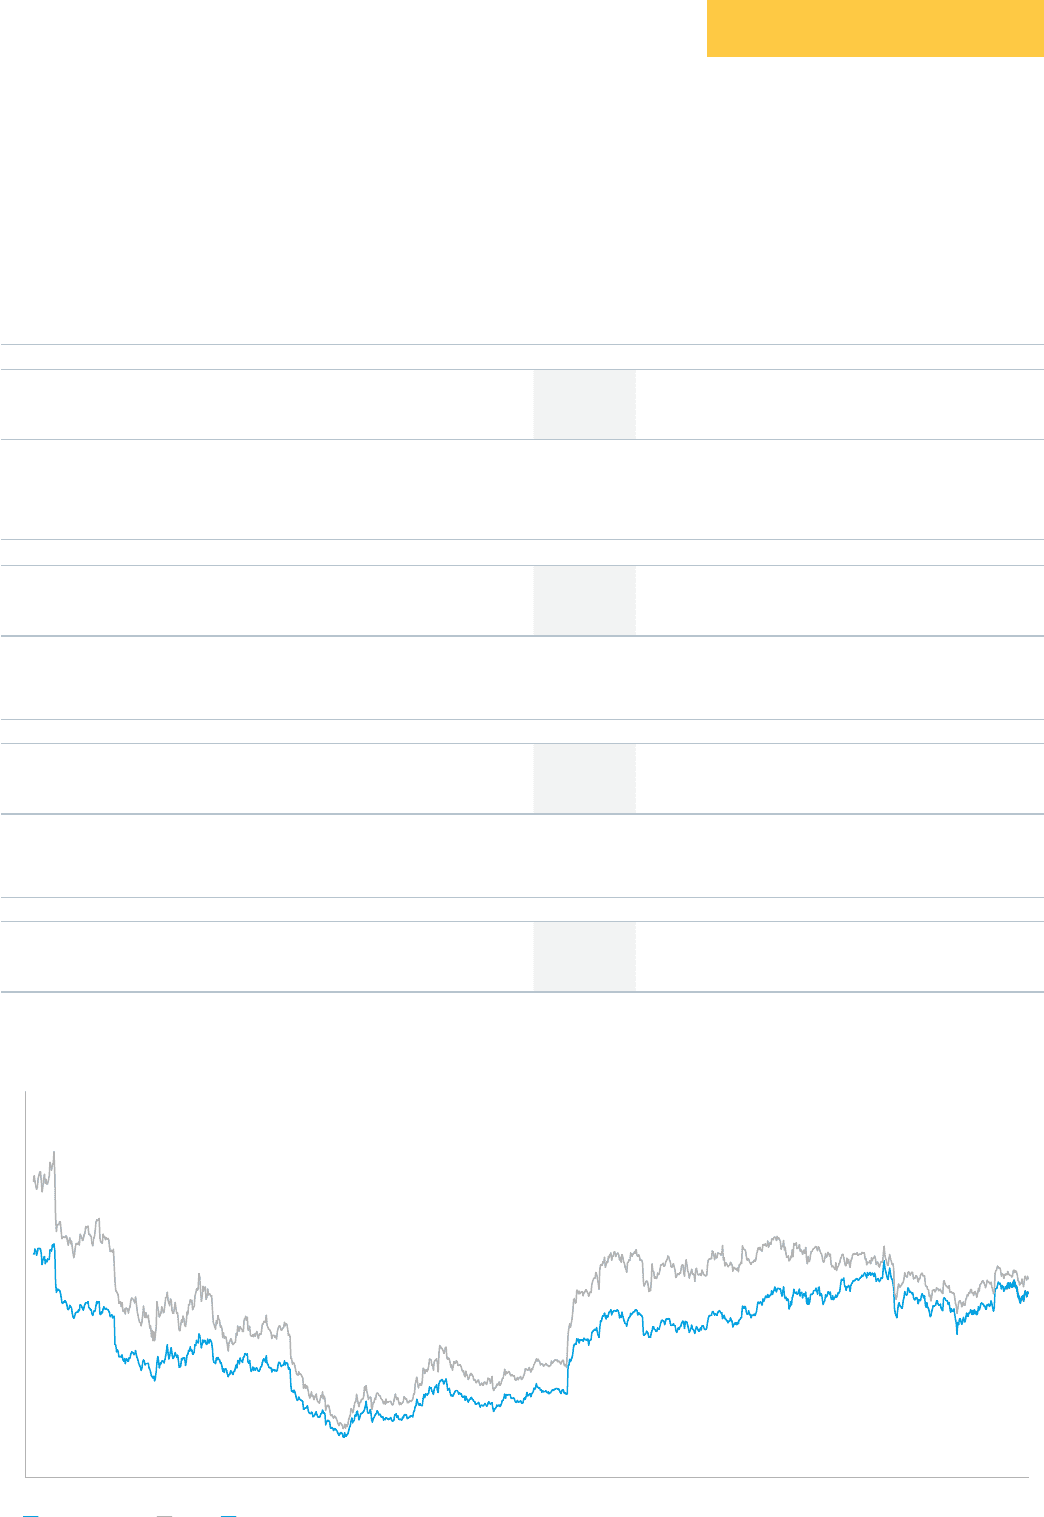
Nokia share prices on Nasdaq Helsinki (EUR), Euronext Paris (EUR) and the New York Stock Exchange (USD) 2011-2015
0
2
4
6
8
10
12
14
Jan 11 Jan 12 Jan 13 Jan 14 Jan 15 Dec 15
Nasdaq Helsinki NYSE Euronext
09
11
10
12
13
Source: Nasdaq Helsinki, the NYSE composite tape and Euronext Paris (since November 2015).