Nokia 2015 Annual Report Download - page 50
Download and view the complete annual report
Please find page 50 of the 2015 Nokia annual report below. You can navigate through the pages in the report by either clicking on the pages listed below, or by using the keyword search tool below to find specific information within the annual report.-
 1
1 -
2
-
3
-
4
-
5
-
6
-
7
-
8
-
9
-
10
-
11
-
12
-
13
-
14
-
15
-
16
-
17
-
18
-
19
-
20
-
21
-
22
-
23
-
24
-
25
-
26
-
27
-
28
-
29
-
30
-
31
-
32
-
33
-
34
-
35
-
36
-
37
-
38
-
39
-
 40
40 -
 41
41 -
 42
42 -
 43
43 -
 44
44 -
 45
45 -
 46
46 -
 47
47 -
 48
48 -
 49
49 -
 50
50 -
 51
51 -
 52
52 -
 53
53 -
 54
54 -
 55
55 -
 56
56 -
 57
57 -
 58
58 -
 59
59 -
 60
60 -
61
-
62
-
63
-
64
-
65
-
66
-
67
-
68
-
69
-
70
-
71
-
72
-
73
-
74
-
75
-
76
-
77
-
78
-
79
-
80
-
81
-
82
-
83
-
84
-
85
-
86
-
87
-
88
-
89
-
90
-
91
-
92
-
93
-
94
-
95
-
96
-
97
-
98
-
99
-
100
-
101
-
102
-
103
-
104
-
105
-
106
-
107
-
108
-
109
-
110
-
111
-
112
-
113
-
114
-
115
-
116
-
117
-
118
-
119
-
120
-
121
-
122
-
123
-
124
-
125
-
126
-
127
-
128
-
129
-
130
-
131
-
132
-
133
-
134
-
135
-
136
-
137
-
138
-
139
-
140
-
141
-
142
-
143
-
144
-
145
-
146
-
147
-
148
-
149
-
150
-
151
-
152
-
153
-
154
-
155
-
156
-
157
-
158
-
159
-
160
-
161
-
162
-
163
-
164
-
165
-
166
-
167
-
168
-
169
-
170
-
171
-
172
-
173
-
174
-
175
-
176
-
177
-
178
-
179
-
180
-
181
-
182
-
183
-
184
-
185
-
186
-
187
-
188
-
189
-
190
-
191
-
192
-
193
-
194
-
195
-
196
-
197
-
198
-
199
-
200
-
201
-
202
-
203
-
204
-
205
-
206
-
207
-
208
-
209
-
210
-
211
-
212
-
213
-
214
-
215
-
216
 |
 |
48 NOKIA IN 2015
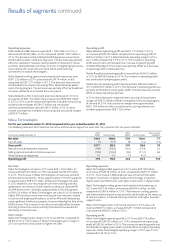
Results of operations continued
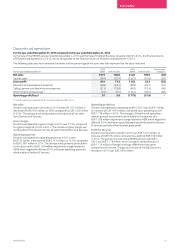
Our selling, general and administrative expenses for Continuing
operations in 2015 were EUR 1 652 million, an increase of
EUR 199 million, or 14%, compared to EUR 1 453 million in 2014.
Selling, general and administrative expenses represented 13.2% of
our net sales in 2015 compared to 12.4% in 2014. The increase in
selling, general and administrative expenses was attributable to higher
selling, general and administrative expenses in Nokia Networks, and to
a lesser extent in Group Common Functions and Nokia Technologies.
The increase in Nokia Networks selling, general and administrative
expenses was primarily attributable to higher personnel expenses,
partially oset by a continued focus on cost eciency. The increase in
Group Common Functions selling, general and administrative expenses
was primarily attributable to transaction and other related costs.
In2015, Group Common Functions included transaction-related
costsofEUR 99 million compared to EUR 29 million in 2014. The
increase in Nokia Technologies selling, general and administrative
expenses was primarily attributable to the ramp-up of new businesses,
increased licensing activities, and higher business support costs.
Selling, general and administrative expenses included purchase price
accounting-related items of EUR 44 million in 2015 compared to
EUR 35 million in2014.
Other income and expenses for Continuing operations in 2015
wasanet income of EUR 13 million, an increase of EUR 107 million,
compared to a net expense of EUR 94 million in 2014. The increase
inother income and expenses was primarily attributable to Group
Common Functions, and to a lesser extent Nokia Networks and
NokiaTechnologies. Group Common Functions other income and
expenses in 2015 included net income of approximately EUR 100
million related to investments made through unlisted venture funds.
The change in Nokia Networks other income and expenses in 2015
wasprimarily attributable to the absence of a EUR 31 million charge
in2014 for anticipated contractual remediation costs related to a
technical issue with a third party component, lower costs related to
the sale of receivables, lower net indirect tax expenses and the release
of certain doubtful account allowances, partially oset by higher
restructuring and associated charges. Nokia Networks other income
and expenses included restructuring and associated charges of
EUR 121 million in 2015 compared to EUR 57 million in 2014.
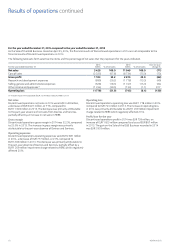
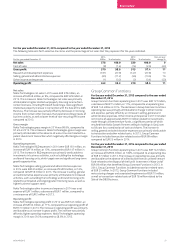
Operating prot
Our operating prot for Continuing operations in 2015 was
EUR 1 688 million, an increase of EUR 276 million, or 19.5%, compared
to an operating prot of EUR 1 412 million in 2014. The increase in
operating prot was primarily attributable to an increase in operating
prot in Nokia Technologies and a lower operating loss from Group
Common Functions, partially oset by lower operating prot in Nokia
Networks. Our operating prot in 2015 included purchase price
accounting-related items, restructuring charges and other special
items of EUR 261 million compared to EUR 188 million in 2014. Our
operating margin in 2015 was 13.5% compared to 12.0% in 2014.
Financial income and expenses
Financial income and expenses for Continuing operations was a net
expense of EUR 177 million in 2015 compared to a net expense of
EUR401 million in 2014, a decrease of EUR 224 million, or 56%.
Thelower net nancial expense in 2015 was primarily attributable to
the absence of a nancial expense of EUR 123 million relating to the
redemption of all material Nokia Networks’ borrowings in 2014, and
theabsence of a non-cash charge of EUR 57 million relating to the
repayment of EUR 1 500 million convertible bonds issued to Microsoft.
Refer to “—Liquidity and capital resources” below.
Prot before tax
Our prot before tax for Continuing operations in 2015 was
EUR 1 540 million, an increase of EUR 541 million compared to
EUR 999 million in2014.
Income tax
Income taxes for Continuing operations was a net expense of
EUR346million in 2015, a change of EUR 2 065 million compared
to a net benet of EUR 1 719 million in 2014. In 2014, the net
incometax benet was primarily attributable to the recognition of
EUR 2 126 million deferred tax assets following the reassessment
ofrecoverability of tax assets in Finland and Germany.
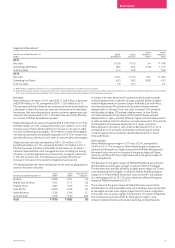
Prot attributable to equity holders of the parent and earnings
pershare
Prot attributable to equity holders of the parent in 2015 was
EUR2466 million, a decrease of EUR 996 million, compared to a prot
of EUR 3 462 million in 2014. Continuing operations generated prot
attributable to equity holders of the parent in 2015 of EUR 1 192 million
compared to a prot of EUR 2 710 million in 2014. Prot attributable
to equity holders of the parent in 2014 was favorably impacted by the
recognition of EUR 2 126 million deferred tax assets. Nokia Group’s
total basic EPS in 2015 decreased to EUR 0.67 (basic) and EUR 0.63
(diluted) compared to EUR 0.94 (basic) and EUR 0.85 (diluted) in 2014.
From Continuing operations, EPS in 2015 decreased to EUR 0.32
(basic) and EUR 0.31 (diluted) compared to EUR 0.73 (basic) and
EUR0.67 (diluted) in 2014.