Nokia 2015 Annual Report Download - page 57
Download and view the complete annual report
Please find page 57 of the 2015 Nokia annual report below. You can navigate through the pages in the report by either clicking on the pages listed below, or by using the keyword search tool below to find specific information within the annual report.-
 1
1 -
2
-
3
-
4
-
5
-
6
-
7
-
8
-
9
-
10
-
11
-
12
-
13
-
14
-
15
-
16
-
17
-
18
-
19
-
20
-
21
-
22
-
23
-
24
-
25
-
26
-
27
-
28
-
29
-
30
-
31
-
32
-
33
-
34
-
35
-
36
-
37
-
38
-
39
-
40
-
41
-
42
-
43
-
44
-
45
-
46
-
 47
47 -
 48
48 -
 49
49 -
 50
50 -
 51
51 -
 52
52 -
 53
53 -
 54
54 -
 55
55 -
 56
56 -
 57
57 -
 58
58 -
 59
59 -
 60
60 -
 61
61 -
 62
62 -
 63
63 -
 64
64 -
 65
65 -
 66
66 -
 67
67 -
68
-
69
-
70
-
71
-
72
-
73
-
74
-
75
-
76
-
77
-
78
-
79
-
80
-
81
-
82
-
83
-
84
-
85
-
86
-
87
-
88
-
89
-
90
-
91
-
92
-
93
-
94
-
95
-
96
-
97
-
98
-
99
-
100
-
101
-
102
-
103
-
104
-
105
-
106
-
107
-
108
-
109
-
110
-
111
-
112
-
113
-
114
-
115
-
116
-
117
-
118
-
119
-
120
-
121
-
122
-
123
-
124
-
125
-
126
-
127
-
128
-
129
-
130
-
131
-
132
-
133
-
134
-
135
-
136
-
137
-
138
-
139
-
140
-
141
-
142
-
143
-
144
-
145
-
146
-
147
-
148
-
149
-
150
-
151
-
152
-
153
-
154
-
155
-
156
-
157
-
158
-
159
-
160
-
161
-
162
-
163
-
164
-
165
-
166
-
167
-
168
-
169
-
170
-
171
-
172
-
173
-
174
-
175
-
176
-
177
-
178
-
179
-
180
-
181
-
182
-
183
-
184
-
185
-
186
-
187
-
188
-
189
-
190
-
191
-
192
-
193
-
194
-
195
-
196
-
197
-
198
-
199
-
200
-
201
-
202
-
203
-
204
-
205
-
206
-
207
-
208
-
209
-
210
-
211
-
212
-
213
-
214
-
215
-
216
 |
 |

55
Board review
NOKIA IN 2015
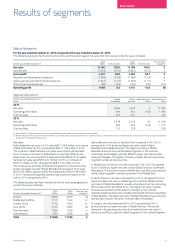
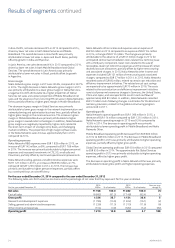
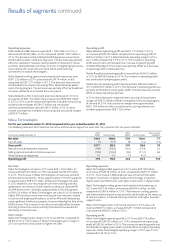
Segment information(1)
For the year ended December 31
EURm
Mobile
Broadband
Global
Services
Nokia
Networks
Other(2)
Nokia
Networks
Total
2014
Net sales 6 039 5 105 54 11 198
Operating prot/(loss) 683 653 (126) 1 210
% of net sales 11.3 12.8 – 10.8
2013
Net sales 5 347 5 753 182 11 282
Operating loss/(loss) 420 693 (693) 420
% of net sales 7.9 12.0 – 3.7
(1) Refer to Note 2, Segment information, of our consolidated nancial statements included in this annual report.
(2) Nokia Networks Other includes net sales and related cost of sales and operating expenses of non-core businesses, IPR net sales and related costs, as well as Nokia Networks’ Optical business until May 6,
2013, when its divestment was completed. It also includes restructuring and associated charges for the Nokia Networks business.
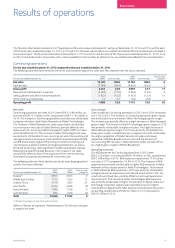
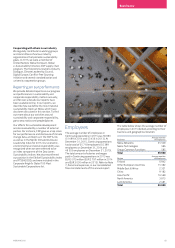
Net sales
Nokia Networks net sales in 2014 were EUR 11 198 million, a decrease
of EUR 84 million, or 1%, compared to EUR 11 282 million in 2013.
Thedecrease in Nokia Networks net sales was primarily attributable to
a decrease in Global Services net sales and the absence of sales from
businesses that were divested and certain customer agreements and
countries that were exited in 2013. The decrease was partly oset by
an increase in Mobile Broadband net sales.
Mobile Broadband net sales increased to EUR 6 039 million in 2014 by
EUR 692 million, or 13%, compared to EUR 5 347 million in 2013. The
increase was primarily attributable to an increase in net sales in radio
and core networking technologies. The increase in radio technologies
net sales was primarily attributable to growth in LTE. The increase was
partially oset by a decrease in net sales in mature radio technologies.
Global Services net sales decreased to EUR 5 105 million in 2014
byEUR 648 million, or 11%, compared to EUR 5 753 million in 2013.
The decrease was primarily attributable to decreases in net sales in
network implementation and managed services including the exiting
ofcertain customer agreements and countries, as well as a decrease
inthe care business line. The decrease was partially oset by an
increase in net sales in the systems integration business line.
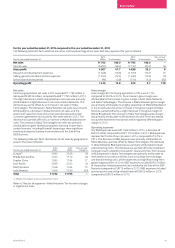
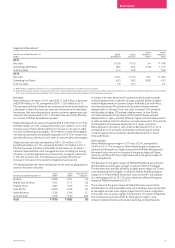
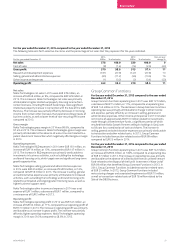
The following table sets forth distribution of net sales by geographical
area for the years indicated.
For the year ended December 31
2014
EURm
2013
EURm
Year-on-year
change %
Europe 2 929 3 041 (4)
Middle East & Africa 1 053 1 111 (5)
Greater China 1 380 1 185 16
Asia-Pacic 3 289 3 354 (2)
North America 1 538 1 334 15
Latin America 1 009 1 257 (20)
Total 11 198 11 282 (1)
In Europe, net sales decreased 4% primarily attributable to lower
network deployments in Western Europe, partially oset by higher
network deployments in Eastern Europe. In Middle East and Africa,
netsales decreased 5% primarily attributable to lower network
deployments. In Greater China, net sales increased 16% primarily
attributable to higher LTE network deployments. In Asia-Pacic,
netsales decreased 2% primarily attributable to lower network
deployments in Japan, partially oset by higher network deployments
in India and Korea. In North America, net sales increased 15% primarily
attributable to LTE network deployments at major customers.
NokiaNetworks net sales in Latin America decreased 20% in 2014
compared to 2013 primarily attributable to the exiting of certain
customer agreements and lower network deployments in Brazil,
Chileand Mexico.
Gross margin
Nokia Networks gross margin in 2014 was 38.7%, compared to
36.6%in 2013. The increase in Nokia Networks gross margin was
primarily attributable to a higher proportion of Mobile Broadband in
the overall sales mix and an increase in the gross margin of Global
Services, partially oset by a slight decrease in the gross margin of
Mobile Broadband.
The decrease in the gross margin of Mobile Broadband was primarily
attributable to a lower gross margin in mature radio technologies.
Thedecrease was partially oset by a higher gross margin in LTE and
core networking technologies. In addition, Mobile Broadband gross
margin in 2014 benetted from lower costs incurred in anticipation
ofa technology shift to TD-LTE, which adversely aected the gross
margin of Mobile Broadband in 2013.
The increase in the gross margin of Global Services was primarily
attributable to a more favorable sales mix including a lower proportion
of managed services and a higher proportion of systems integration
inthe sales mix, as well as margin improvement in systems integration.
The increase was partially oset by lower gross margin in care,
networkimplementation and network planning and optimization.