Nokia 2015 Annual Report Download - page 56
Download and view the complete annual report
Please find page 56 of the 2015 Nokia annual report below. You can navigate through the pages in the report by either clicking on the pages listed below, or by using the keyword search tool below to find specific information within the annual report.-
 1
1 -
2
-
3
-
4
-
5
-
6
-
7
-
8
-
9
-
10
-
11
-
12
-
13
-
14
-
15
-
16
-
17
-
18
-
19
-
20
-
21
-
22
-
23
-
24
-
25
-
26
-
27
-
28
-
29
-
30
-
31
-
32
-
33
-
34
-
35
-
36
-
37
-
38
-
39
-
40
-
41
-
42
-
43
-
44
-
45
-
 46
46 -
 47
47 -
 48
48 -
 49
49 -
 50
50 -
 51
51 -
 52
52 -
 53
53 -
 54
54 -
 55
55 -
 56
56 -
 57
57 -
 58
58 -
 59
59 -
 60
60 -
 61
61 -
 62
62 -
 63
63 -
 64
64 -
 65
65 -
 66
66 -
67
-
68
-
69
-
70
-
71
-
72
-
73
-
74
-
75
-
76
-
77
-
78
-
79
-
80
-
81
-
82
-
83
-
84
-
85
-
86
-
87
-
88
-
89
-
90
-
91
-
92
-
93
-
94
-
95
-
96
-
97
-
98
-
99
-
100
-
101
-
102
-
103
-
104
-
105
-
106
-
107
-
108
-
109
-
110
-
111
-
112
-
113
-
114
-
115
-
116
-
117
-
118
-
119
-
120
-
121
-
122
-
123
-
124
-
125
-
126
-
127
-
128
-
129
-
130
-
131
-
132
-
133
-
134
-
135
-
136
-
137
-
138
-
139
-
140
-
141
-
142
-
143
-
144
-
145
-
146
-
147
-
148
-
149
-
150
-
151
-
152
-
153
-
154
-
155
-
156
-
157
-
158
-
159
-
160
-
161
-
162
-
163
-
164
-
165
-
166
-
167
-
168
-
169
-
170
-
171
-
172
-
173
-
174
-
175
-
176
-
177
-
178
-
179
-
180
-
181
-
182
-
183
-
184
-
185
-
186
-
187
-
188
-
189
-
190
-
191
-
192
-
193
-
194
-
195
-
196
-
197
-
198
-
199
-
200
-
201
-
202
-
203
-
204
-
205
-
206
-
207
-
208
-
209
-
210
-
211
-
212
-
213
-
214
-
215
-
216
 |
 |

54 NOKIA IN 2015
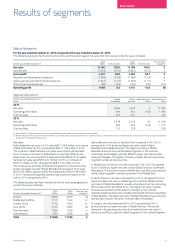
Results of segments continued
In Asia-Pacic, net sales decreased 2% in 2015 compared to 2014,
driven by lower net sales in both Global Services and Mobile
Broadband. The overall decrease in Asia-Pacic was primarily
attributable to lower net sales in Japan and South Korea, partially
oset by growth in India and Myanmar.
In Latin America, net sales decreased 4% in 2015 compared to 2014,
driven by lower net sales in both Mobile Broadband and Global
Services. The overall decrease in Latin America was primarily
attributable to lower net sales in Brazil, partially oset by growth
inArgentina.
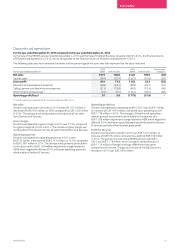
Gross margin
Nokia Networks gross margin in 2015 was 38.6%, compared to 38.7%
in 2014. The slight decrease in Nokia Networks gross margin in 2015
was primarily attributable to a lower gross margin in Global Services,
anegative mix shift attributable to a higher proportion of Global
Services net sales and a lower proportion of Mobile Broadband net
sales and the absence of non-recurring IPR net sales in Nokia Networks
Other, partially oset by a higher gross margin in Mobile Broadband.
The decrease in gross margin in Global Services was primarily
attributable to lower gross margin in the network implementation and
network planning and optimization business lines, partially oset by
higher gross margin in the care business line. The increase in gross
margin in Mobile Broadband was primarily attributable to higher
grossmargin in overall radio technologies. In addition, Nokia Networks
gross margin was negatively impacted by higher costs related to
theshort-term impact of strategic entry deals, and challenging
marketconditions. The proportion of high margin software sales
intheNokia Networks sales mix was approximately at in 2015
compared to 2014.
Operating expenses
Nokia Networks R&D expenses were EUR 1 928 million in 2015, an
increase of EUR 142 million, or 8%, compared to EUR 1 786 million
in2014. The increase was primarily attributable to higher personnel
expenses and increased investments in LTE, 5G, small cells and
Cloudcore, partially oset by continued operational improvements.
Nokia Networks selling, general and administrative expenses were
EUR 1 321 million in 2015, an increase of EUR 85 million, or 7%,
compared to EUR 1 236 million in 2014. In 2015, the increase was
primarily attributable to higher personnel expenses, partially oset
bya continued focus on cost eciency.
Nokia Networks other income and expenses was an expense of
EUR 92 million in 2015 compared to an expense of EUR 104 million
in2014, achange of EUR 12 million. The change was primarily
attributable to the absence of a EUR 31 million charge in 2014 for
anticipated contractual remediation costs related to a technical issue
with a third party component, lower costs related to the sale of
receivables, lower net indirect tax expenses and the release of certain
doubtful account allowances, partially oset by higher restructuring
and associated charges. In 2015, Nokia Networks other income and
expenses included EUR 121 million of restructuring and associated
charges, compared to EUR 57 million in 2014. In 2015, Nokia Networks
recorded costs of EUR 85 million, related to certain cost reduction and
eciency improvement initiatives. The related annual cost savings
areexpected to be approximately EUR 70 million in 2016. The costs
related to the cost reduction and eciency improvement initiatives
consist of personnel severance charges in Germany, the United States,
China and Japan, and are expected to result in cash outows of
approximately EUR 80 million. In addition, Nokia Networks recorded
EUR 37 million costs following changes in estimates for the Brazil and
Germany provisions, related to the global restructuring program
announced in 2011.
Operating prot
Nokia Networks operating prot was EUR 1 096 million in 2015, a
decrease of EUR 114 million compared to EUR1210 million in 2014.
Nokia Networks operating margin in 2015 was 9.5% compared to
10.8% in 2014. The decrease in operating prot was primarily
attributable to lower operating prot in Mobile Broadband and Nokia
Networks Other.
Mobile Broadband operating prot decreased from EUR 683 million
in2014 to EUR 604 million in 2015. The decrease in Mobile Broadband
operating prot in 2015 was primarily attributable to higher operating
expenses, partially oset by higher gross prot.
Global Services operating prot was EUR 654 million in 2015 compared
to EUR 653 million in 2014. The approximately at Global Services
operating prot in 2015 was primarily attributable to higher operating
expenses, oset by higher gross prot.
The decrease in operating prot in Nokia Networks Other was primarily
attributable to lower gross prot and higher operating expenses.
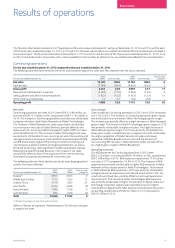
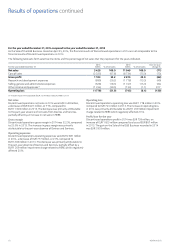
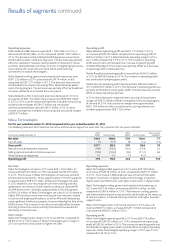
For the year ended December 31, 2014 compared to the year ended December 31, 2013
The following table sets forth selective line items and the percentage of net sales that they represent for the years indicated.
For the year ended December 31
2014
EURm % of net sales
2013
EURm % of net sales
Year-on-year
change %
Net sales 11 198 100.0 11 282 100.0 (1)
Cost of sales (6 862) (61.3) (7 148) (63.4) 4
Gross prot 4 336 38.7 4 134 36.6 5
Research and development expenses (1 786) (15.9) (1 822) (16.1) (2)
Selling, general and administrative expenses (1 236) (11.0) (1 310) (11.6) (6)
Other income and expenses (104) (0.9) (582) (5.2) (82)
Operating prot 1 210 10.8 420 3.7 188