Nokia 2015 Annual Report Download - page 184
Download and view the complete annual report
Please find page 184 of the 2015 Nokia annual report below. You can navigate through the pages in the report by either clicking on the pages listed below, or by using the keyword search tool below to find specific information within the annual report.-
 1
1 -
2
-
3
-
4
-
5
-
6
-
7
-
8
-
9
-
10
-
11
-
12
-
13
-
14
-
15
-
16
-
17
-
18
-
19
-
20
-
21
-
22
-
23
-
24
-
25
-
26
-
27
-
28
-
29
-
30
-
31
-
32
-
33
-
34
-
35
-
36
-
37
-
38
-
39
-
40
-
41
-
42
-
43
-
44
-
45
-
46
-
47
-
48
-
49
-
50
-
51
-
52
-
53
-
54
-
55
-
56
-
57
-
58
-
59
-
60
-
61
-
62
-
63
-
64
-
65
-
66
-
67
-
68
-
69
-
70
-
71
-
72
-
73
-
74
-
75
-
76
-
77
-
78
-
79
-
80
-
81
-
82
-
83
-
84
-
85
-
86
-
87
-
88
-
89
-
90
-
91
-
92
-
93
-
94
-
95
-
96
-
97
-
98
-
99
-
100
-
101
-
102
-
103
-
104
-
105
-
106
-
107
-
108
-
109
-
110
-
111
-
112
-
113
-
114
-
115
-
116
-
117
-
118
-
119
-
120
-
121
-
122
-
123
-
124
-
125
-
126
-
127
-
128
-
129
-
130
-
131
-
132
-
133
-
134
-
135
-
136
-
137
-
138
-
139
-
140
-
141
-
142
-
143
-
144
-
145
-
146
-
147
-
148
-
149
-
150
-
151
-
152
-
153
-
154
-
155
-
156
-
157
-
158
-
159
-
160
-
161
-
162
-
163
-
164
-
165
-
166
-
167
-
168
-
169
-
170
-
171
-
172
-
173
-
 174
174 -
 175
175 -
 176
176 -
 177
177 -
 178
178 -
 179
179 -
 180
180 -
 181
181 -
 182
182 -
 183
183 -
 184
184 -
 185
185 -
 186
186 -
 187
187 -
 188
188 -
 189
189 -
 190
190 -
 191
191 -
 192
192 -
 193
193 -
 194
194 -
195
-
196
-
197
-
198
-
199
-
200
-
201
-
202
-
203
-
204
-
205
-
206
-
207
-
208
-
209
-
210
-
211
-
212
-
213
-
214
-
215
-
216
 |
 |

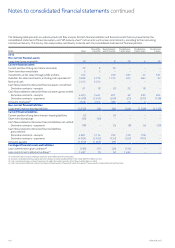
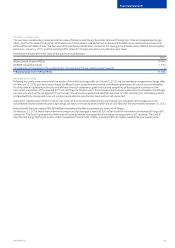
182 NOKIA IN 2015
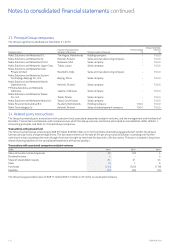
Notes to consolidated nancial statements continued
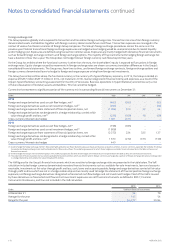
The following table presents an undiscounted cash ow analysis for both nancial liabilities and nancial assets that are presented on the
consolidated statement of nancial position, and “o-balance sheet” instruments such as loan commitments, according to their remaining
contractual maturity. The line-by-line analysis does not directly reconcile with the consolidated statement of nancial position.
EURm Total
Due within
3 months
Due between 3
and 12 months
Due between
1 and 3 years
Due between
3 and 5 years
Due beyond
5 years
2015
Non-current nancial assets
Long-term loans receivable 58 – 8 28 4 18
Current nancial assets
Current portion of long-term loans receivable 20 2 18 – – –
Short-term loans receivable 2 2 – – – –
Investments at fair value through prot and loss 742 –256 265 57 164
Available-for-sale investments, including cash equivalents(1) 6 938 4 714 1 105 403 663 53
Bank and cash 2 242 2 242 ––––
Cash ows related to derivative nancial assets net settled:
Derivative contracts—receipts 51 18 (7) 22 18 –
Cash ows related to derivative nancial assets gross settled:
Derivative contracts—receipts 4 203 3 441 221 42 295 204
Derivative contracts—payments (4 078) (3 431) (209) (23) (277) (138)
Accounts receivable(2) 2628 2014 586 25 3 –
Non-current nancial liabilities
Long-term interest-bearing liabilities (3 070) (34) (84) (244) (1 549) (1 159)
Current nancial liabilities
Current portion of long-term interest-bearing liabilities (2) –(2) – – –
Short-term borrowings (50) (50) – – – –
Cash ows related to derivative nancial liabilities net settled:
Derivative contracts—payments (78) –(5) (8) (6) (59)
Cash ows related to derivative nancial liabilities
grosssettled:
Derivative contracts—receipts 4 901 3 114 760 318 709 –
Derivative contracts—payments (4 924) (3 162) (753) (302) (707) –
Accounts payable (1 910) (1 835) (75) –––
Contingent nancial assets and liabilities
Loan commitments given undrawn(3) (180) (17) (39) (124) – –
Loan commitments obtained undrawn(4) 1 487 (1) (4) 1 492 – –
(1) Instruments that include a call feature have been presented at their nal maturities.
(2) Accounts receivable maturity analysis does not include accrued receivables of EUR 1 285 million (EUR 703 million in 2014).
(3) Loan commitments given undrawn have been included in the earliest period in which they could be drawn or called.
(4) Loan commitments obtained undrawn have been included based on the period in which they expire. These amounts include related commitment fees.