Nokia 2015 Annual Report Download - page 55
Download and view the complete annual report
Please find page 55 of the 2015 Nokia annual report below. You can navigate through the pages in the report by either clicking on the pages listed below, or by using the keyword search tool below to find specific information within the annual report.-
 1
1 -
2
-
3
-
4
-
5
-
6
-
7
-
8
-
9
-
10
-
11
-
12
-
13
-
14
-
15
-
16
-
17
-
18
-
19
-
20
-
21
-
22
-
23
-
24
-
25
-
26
-
27
-
28
-
29
-
30
-
31
-
32
-
33
-
34
-
35
-
36
-
37
-
38
-
39
-
40
-
41
-
42
-
43
-
44
-
 45
45 -
 46
46 -
 47
47 -
 48
48 -
 49
49 -
 50
50 -
 51
51 -
 52
52 -
 53
53 -
 54
54 -
 55
55 -
 56
56 -
 57
57 -
 58
58 -
 59
59 -
 60
60 -
 61
61 -
 62
62 -
 63
63 -
 64
64 -
 65
65 -
66
-
67
-
68
-
69
-
70
-
71
-
72
-
73
-
74
-
75
-
76
-
77
-
78
-
79
-
80
-
81
-
82
-
83
-
84
-
85
-
86
-
87
-
88
-
89
-
90
-
91
-
92
-
93
-
94
-
95
-
96
-
97
-
98
-
99
-
100
-
101
-
102
-
103
-
104
-
105
-
106
-
107
-
108
-
109
-
110
-
111
-
112
-
113
-
114
-
115
-
116
-
117
-
118
-
119
-
120
-
121
-
122
-
123
-
124
-
125
-
126
-
127
-
128
-
129
-
130
-
131
-
132
-
133
-
134
-
135
-
136
-
137
-
138
-
139
-
140
-
141
-
142
-
143
-
144
-
145
-
146
-
147
-
148
-
149
-
150
-
151
-
152
-
153
-
154
-
155
-
156
-
157
-
158
-
159
-
160
-
161
-
162
-
163
-
164
-
165
-
166
-
167
-
168
-
169
-
170
-
171
-
172
-
173
-
174
-
175
-
176
-
177
-
178
-
179
-
180
-
181
-
182
-
183
-
184
-
185
-
186
-
187
-
188
-
189
-
190
-
191
-
192
-
193
-
194
-
195
-
196
-
197
-
198
-
199
-
200
-
201
-
202
-
203
-
204
-
205
-
206
-
207
-
208
-
209
-
210
-
211
-
212
-
213
-
214
-
215
-
216
 |
 |

53
Board review
NOKIA IN 2015
Results of segments
Nokia Networks
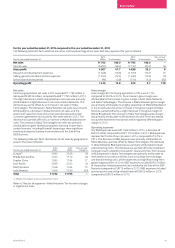
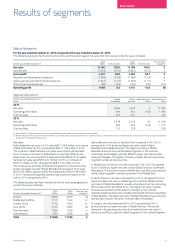
For the year ended December 31, 2015 compared to the year ended December 31, 2014
The following table sets forth selective line items and the percentage of net sales that they represent for the years indicated.
For the year ended December 31
2015
EURm % of net sales
2014
EURm % of net sales
Year-on-year
change %
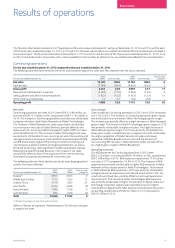
Net sales 11 490 100.0 11 198 100.0 3
Cost of sales (7 053) (61.4) (6 862) (61.3) 3
Gross prot 4 437 38.6 4 336 38.7 2
Research and development expenses (1 928) (16.8) (1 786) (15.9) 8
Selling, general and administrative expenses (1 321) (11.5) (1 236) (11.0) 7
Other income and expenses (92) (0.8) (104) (0.9) (12)
Operating prot 1 096 9.5 1 210 10.8 (9)
Segment information(1)
For the year ended December 31
EURm
Mobile
Broadband
Global
Services
Nokia Networks
Other(2)
Nokia Networks
Total
2015
Net sales 6 064 5 422 4 11 490
Operating prot/(loss) 604 654 (162) 1 096
% of net sales 10.0 12.1 –9.5
2014
Net sales 6 039 5 105 54 11 198
Operating prot/(loss) 683 653 (126) 1 210
% of net sales 11.3 12.8 –10.8
(1) Refer to Note 2, Segment information, of our consolidated nancial statements included in this annual report.
(2) Nokia Networks Other includes net sales and related cost of sales and operating expenses of non-core businesses, as well as IPR net sales and related costs. It also includes restructuring and associated
charges for the Nokia Networks business.
Net sales
Nokia Networks net sales in 2015 were EUR 11 490 million, an increase
of EUR 292 million, or 3%, compared to EUR 11 198 million in 2014.
The increase in Nokia Networks net sales was primarily attributable
toan increase in net sales in Global Services, partially oset by the
absence of non-recurring IPR net sales which beneted 2014. Global
Services net sales were EUR 5 422 million in 2015, an increase of
EUR 317 million, or 6%, compared to EUR 5 105 million in 2014.
Theincrease was primarily attributable to growth in all business lines
except managed services. Mobile Broadband net sales in 2015 were
EUR 6 064 million, approximately at compared to EUR 6 039 million
in2014. Foreign exchange uctuations had a positive impact on net
sales in 2015 compared to 2014.
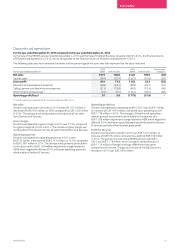
The following table sets forth distribution of net sales by geographical
area for the years indicated.
For the year ended December 31
2015
EURm
2014
EURm
Year-on-year
change %
Europe 2 804 2 929 (4)
Middle East & Africa 1 177 1 053 12
Greater China 1 712 1 380 24
Asia-Pacic 3 230 3 289 (2)
North America 1 594 1 538 4
Latin America 973 1 009 (4)
Total 11 490 11 198 3
Nokia Networks net sales in Greater China increased 24% in 2015
compared to 2014 driven by higher net sales in both Mobile
Broadband and Global Services. The higher net sales in Mobile
Broadband was primarily attributable to growth in LTE and core
networking technologies, partially oset by lower net sales in other
radio technologies. The higher net sales in Global Services was driven
by growth across all business lines.
In Middle East and Africa, net sales increased 12% in 2015 compared
to 2014 driven by higher net sales in both Global Services and Mobile
Broadband. The overall increase in Middle East and Africa was primarily
attributable to growth in several countries in the Middle East.
In North America, net sales increased 4% in 2015 compared to 2014,
driven by higher net sales in Global Services, partially oset by lower
net sales in Mobile Broadband, as well as the absence of non-recurring
IPR net sales which beneted 2014. The higher net sales in Global
Services was primarily attributable to strength in the network
implementation business line, including the benet from the acquisition
of SAC Wireless. The lower net sales in Mobile Broadband was primarily
attributable to lower net sales in overall radio technologies.
In Europe, net sales decreased 4% in 2015 compared to 2014,
primarily driven by lower net sales in Global Services. The overall
decrease in Europe was primarily attributable to lower net sales in
Germany and Russia, partially oset by growth in the United Kingdom.