Nokia 2015 Annual Report Download - page 111
Download and view the complete annual report
Please find page 111 of the 2015 Nokia annual report below. You can navigate through the pages in the report by either clicking on the pages listed below, or by using the keyword search tool below to find specific information within the annual report.-
 1
1 -
2
-
3
-
4
-
5
-
6
-
7
-
8
-
9
-
10
-
11
-
12
-
13
-
14
-
15
-
16
-
17
-
18
-
19
-
20
-
21
-
22
-
23
-
24
-
25
-
26
-
27
-
28
-
29
-
30
-
31
-
32
-
33
-
34
-
35
-
36
-
37
-
38
-
39
-
40
-
41
-
42
-
43
-
44
-
45
-
46
-
47
-
48
-
49
-
50
-
51
-
52
-
53
-
54
-
55
-
56
-
57
-
58
-
59
-
60
-
61
-
62
-
63
-
64
-
65
-
66
-
67
-
68
-
69
-
70
-
71
-
72
-
73
-
74
-
75
-
76
-
77
-
78
-
79
-
80
-
81
-
82
-
83
-
84
-
85
-
86
-
87
-
88
-
89
-
90
-
91
-
92
-
93
-
94
-
95
-
96
-
97
-
98
-
99
-
100
-
 101
101 -
 102
102 -
 103
103 -
 104
104 -
 105
105 -
 106
106 -
 107
107 -
 108
108 -
 109
109 -
 110
110 -
 111
111 -
 112
112 -
 113
113 -
 114
114 -
 115
115 -
 116
116 -
 117
117 -
 118
118 -
 119
119 -
 120
120 -
 121
121 -
122
-
123
-
124
-
125
-
126
-
127
-
128
-
129
-
130
-
131
-
132
-
133
-
134
-
135
-
136
-
137
-
138
-
139
-
140
-
141
-
142
-
143
-
144
-
145
-
146
-
147
-
148
-
149
-
150
-
151
-
152
-
153
-
154
-
155
-
156
-
157
-
158
-
159
-
160
-
161
-
162
-
163
-
164
-
165
-
166
-
167
-
168
-
169
-
170
-
171
-
172
-
173
-
174
-
175
-
176
-
177
-
178
-
179
-
180
-
181
-
182
-
183
-
184
-
185
-
186
-
187
-
188
-
189
-
190
-
191
-
192
-
193
-
194
-
195
-
196
-
197
-
198
-
199
-
200
-
201
-
202
-
203
-
204
-
205
-
206
-
207
-
208
-
209
-
210
-
211
-
212
-
213
-
214
-
215
-
216
 |
 |

109
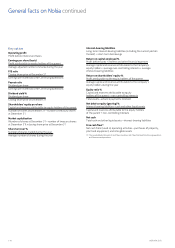
General facts on Nokia
NOKIA IN 2015
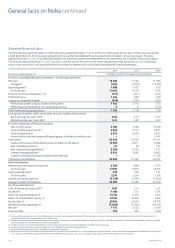
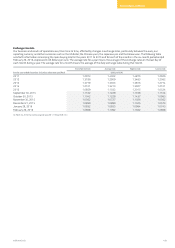
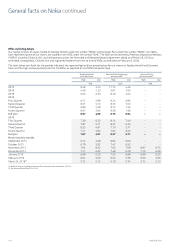
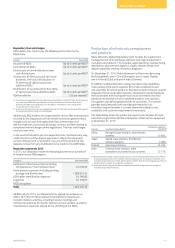
Exchange rate data
Our business and results of operations are, from time to time, aected by changes in exchange rates, particularly between the euro, our
reporting currency, and other currencies such as the US dollar, the Chinese yuan, the Japanese yen and the Korean won. The following table
setsforth information concerning the noon buying rate for the years 2011 to 2015 and for each of the months in the six-month period ended
February 29, 2016, expressed in US dollars per euro. The average rate for a year means the average of the exchange rates on the last day of
each month during a year. The average rate for a month means the average of the daily exchange rates during that month.
For the year ended December 31 (unless otherwise specied)
End of period rate Average rate Highest rate Lowest rate
(USD per EUR)
2011 1.2973 1.4002 1.4875 1.2926
2012 1.3186 1.2909 1.3463 1.2062
2013 1.3779 1.3303 1.3816 1.2774
2014 1.2101 1.3210 1.3927 1.2101
2015 1.0859 1.1032 1.2015 1.0524
September 30, 2015 1.1162 1.1229 1.1358 1.1104
October 30, 2015 1.1042 1.1228 1.1437 1.0963
November 30, 2015 1.0562 1.0727 1.1026 1.0562
December 21, 2015 1.0859 1.0889 1.1025 1.0573
January 29, 2016 1.0832 1.0855 1.0964 1.0743
February 29, 2016 1.0868 1.1092 1.1362 1.0868
On March 24, 2016, the noon buying rate was USD 1.1163 per EUR 1.00.