Nokia 2015 Annual Report Download - page 49
Download and view the complete annual report
Please find page 49 of the 2015 Nokia annual report below. You can navigate through the pages in the report by either clicking on the pages listed below, or by using the keyword search tool below to find specific information within the annual report.-
 1
1 -
2
-
3
-
4
-
5
-
6
-
7
-
8
-
9
-
10
-
11
-
12
-
13
-
14
-
15
-
16
-
17
-
18
-
19
-
20
-
21
-
22
-
23
-
24
-
25
-
26
-
27
-
28
-
29
-
30
-
31
-
32
-
33
-
34
-
35
-
36
-
37
-
38
-
 39
39 -
 40
40 -
 41
41 -
 42
42 -
 43
43 -
 44
44 -
 45
45 -
 46
46 -
 47
47 -
 48
48 -
 49
49 -
 50
50 -
 51
51 -
 52
52 -
 53
53 -
 54
54 -
 55
55 -
 56
56 -
 57
57 -
 58
58 -
 59
59 -
60
-
61
-
62
-
63
-
64
-
65
-
66
-
67
-
68
-
69
-
70
-
71
-
72
-
73
-
74
-
75
-
76
-
77
-
78
-
79
-
80
-
81
-
82
-
83
-
84
-
85
-
86
-
87
-
88
-
89
-
90
-
91
-
92
-
93
-
94
-
95
-
96
-
97
-
98
-
99
-
100
-
101
-
102
-
103
-
104
-
105
-
106
-
107
-
108
-
109
-
110
-
111
-
112
-
113
-
114
-
115
-
116
-
117
-
118
-
119
-
120
-
121
-
122
-
123
-
124
-
125
-
126
-
127
-
128
-
129
-
130
-
131
-
132
-
133
-
134
-
135
-
136
-
137
-
138
-
139
-
140
-
141
-
142
-
143
-
144
-
145
-
146
-
147
-
148
-
149
-
150
-
151
-
152
-
153
-
154
-
155
-
156
-
157
-
158
-
159
-
160
-
161
-
162
-
163
-
164
-
165
-
166
-
167
-
168
-
169
-
170
-
171
-
172
-
173
-
174
-
175
-
176
-
177
-
178
-
179
-
180
-
181
-
182
-
183
-
184
-
185
-
186
-
187
-
188
-
189
-
190
-
191
-
192
-
193
-
194
-
195
-
196
-
197
-
198
-
199
-
200
-
201
-
202
-
203
-
204
-
205
-
206
-
207
-
208
-
209
-
210
-
211
-
212
-
213
-
214
-
215
-
216
 |
 |

47
Board review
NOKIA IN 2015
Results of operations
The nancial information included in this “Operating and nancial review and prospects” section at December 31, 2015 and 2014 and for each
of the three years ended December 31, 2015, 2014 and 2013 has been derived from our audited consolidated nancial statements included in
this annual report. The nancial information at December 31, 2015 and 2014 and for each of the three years ended December 31, 2015, 2014
and 2013 should be read in conjunction with, and are qualied in their entirety by reference to, our audited consolidated nancial statements.
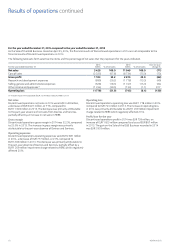
Continuing operations
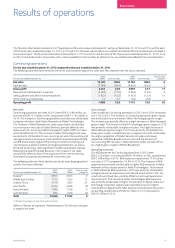
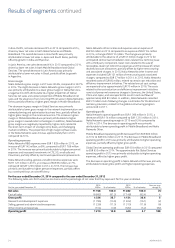
For the year ended December 31, 2015 compared to the year ended December 31, 2014
The following table sets forth selective line items and the percentage of net sales that they represent for the years indicated.
For the year ended December 31
2015
EURm % of net sales
2014
EURm % of net sales
Year-on-year
change %
Net sales 12 499 100.0 11 762 100.0 6
Cost of sales (7 046) (56.4) (6 855) (58.3) 3
Gross prot 5 453 43.6 4 907 41.7 11
Research and development expenses (2 126) (17.0) (1 948) (16.6) 9
Selling, general and administrative expenses (1 652) (13.2) (1 453) (12.4) 14
Other income and expenses 13 0.1 (94) (0.8) –
Operating prot 1 688 13.5 1 412 12.0 20
Net sales
Continuing operations net sales in 2015 were EUR 12 499 million, an
increase of EUR 737 million, or 6%, compared to EUR 11 762 million in
2014. The increase in Continuing operations net sales was attributable
to higher net sales in both Nokia Networks and Nokia Technologies.
The increase in Nokia Networks net sales was primarily attributable
toan increase in net sales in Global Services, partially oset by the
absence of non-recurring intellectual property rights (“IPR”) net sales
which benetted 2014. The increase in Nokia Technologies net sales
was primarily attributable to non-recurring net sales from existing and
new agreements and revenue share related to previously divested IPR,
and IPR divestments; higher IPR licensing income from existing and
new licensees related to settled and ongoing arbitrations; as well as
Microsoft becoming a more signicant intellectual property licensee
following the Sale of the D&S Business. The increase in net sales
waspartially oset by lower licensing income from certain existing
licensees that experienced decreases in handset sales.
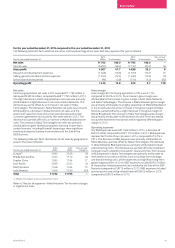
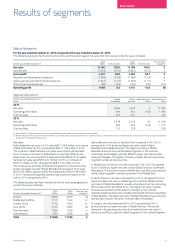
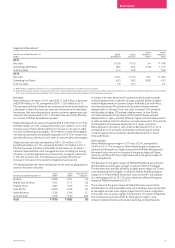
The following table sets forth distribution of net sales by geographical
area for the years indicated.
For the year ended December 31
2015
EURm
2014
EURm
Year-on-year
change %
Europe(1) 3 813 3 493 9
Middle East & Africa 1 177 1 053 12
Greater China 1 712 1 380 24
Asia-Pacic 3 230 3 289 (2)
North America 1 594 1 538 4
Latin America 973 1 009 (4)
Total 12 499 11 762 6
(1) All Nokia Technologies net sales are allocated to Finland.
Refer to “Results of segments—Nokia Networks” for the main changes
in regional net sales.
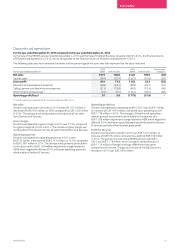
Gross margin
Gross margin for Continuing operations in 2015 was 43.6% compared
to 41.7% in 2014. The increase in Continuing operations gross margin
was attributable to an increase in Nokia Technologies gross margin.
The increase was partially oset by a slight decrease in Nokia Networks
gross margin. The increase in Nokia Technologies gross margin in 2015
was primarily attributable to higher net sales. The slight decrease in
Nokia Networks gross margin in 2015 was primarily attributable to a
lower gross margin in Global Services, a negative mix shift attributable
to a higher proportion of Global Services net sales and a lower
proportion of Mobile Broadband net sales and the absence of
non-recurring IPR net sales in Nokia Networks Other, partially oset
bya higher gross margin in Mobile Broadband.
Operating expenses
Our R&D expenses for Continuing operations in 2015 were
EUR 2 126 million, an increase of EUR 178 million, or 9%, compared to
EUR 1 948 million in 2014. R&D expenses represented 17.0% of our
net sales in 2015 compared to 16.6% in 2014. The increase in R&D
expenses was primarily attributable to higher R&D expenses in Nokia
Networks and to a lesser extent in Nokia Technologies. The increase
inNokia Networks R&D expenses in 2015 was primarily attributable
tohigher personnel expenses and increased investments in LTE, 5G,
small cells and Cloud core, partially oset bycontinued operational
improvements. The increase in Nokia Technologies R&D expenses
wasprimarily attributable to higher investments in digital media and
technology incubation, higher patentportfolio costs and higher
investments in digital health. R&D expenses included purchase price
accounting-related items ofEUR 35 million in 2015 compared to
EUR 32 million in 2014.