Nokia 2015 Annual Report Download - page 202
Download and view the complete annual report
Please find page 202 of the 2015 Nokia annual report below. You can navigate through the pages in the report by either clicking on the pages listed below, or by using the keyword search tool below to find specific information within the annual report.-
 1
1 -
2
-
3
-
4
-
5
-
6
-
7
-
8
-
9
-
10
-
11
-
12
-
13
-
14
-
15
-
16
-
17
-
18
-
19
-
20
-
21
-
22
-
23
-
24
-
25
-
26
-
27
-
28
-
29
-
30
-
31
-
32
-
33
-
34
-
35
-
36
-
37
-
38
-
39
-
40
-
41
-
42
-
43
-
44
-
45
-
46
-
47
-
48
-
49
-
50
-
51
-
52
-
53
-
54
-
55
-
56
-
57
-
58
-
59
-
60
-
61
-
62
-
63
-
64
-
65
-
66
-
67
-
68
-
69
-
70
-
71
-
72
-
73
-
74
-
75
-
76
-
77
-
78
-
79
-
80
-
81
-
82
-
83
-
84
-
85
-
86
-
87
-
88
-
89
-
90
-
91
-
92
-
93
-
94
-
95
-
96
-
97
-
98
-
99
-
100
-
101
-
102
-
103
-
104
-
105
-
106
-
107
-
108
-
109
-
110
-
111
-
112
-
113
-
114
-
115
-
116
-
117
-
118
-
119
-
120
-
121
-
122
-
123
-
124
-
125
-
126
-
127
-
128
-
129
-
130
-
131
-
132
-
133
-
134
-
135
-
136
-
137
-
138
-
139
-
140
-
141
-
142
-
143
-
144
-
145
-
146
-
147
-
148
-
149
-
150
-
151
-
152
-
153
-
154
-
155
-
156
-
157
-
158
-
159
-
160
-
161
-
162
-
163
-
164
-
165
-
166
-
167
-
168
-
169
-
170
-
171
-
172
-
173
-
174
-
175
-
176
-
177
-
178
-
179
-
180
-
181
-
182
-
183
-
184
-
185
-
186
-
187
-
188
-
189
-
190
-
191
-
 192
192 -
 193
193 -
 194
194 -
 195
195 -
 196
196 -
 197
197 -
 198
198 -
 199
199 -
 200
200 -
 201
201 -
 202
202 -
 203
203 -
 204
204 -
 205
205 -
 206
206 -
 207
207 -
 208
208 -
 209
209 -
 210
210 -
 211
211 -
 212
212 -
213
-
214
-
215
-
216
 |
 |
200 NOKIA IN 2015
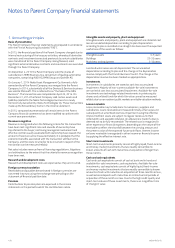
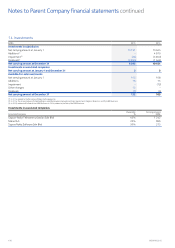
Financial assets and liabilities recorded at fair value are categorized based on the amount of unobservable inputs used to measure their fair
value. Three hierarchical levels are based on an increasing amount of judgment associated with the inputs used to derive fair valuation for these
assets and liabilities, level 1 being market values and level 3, requiring most management judgment. At the end of each reporting period, the
Company categorizes its nancial assets and liabilities to the appropriate level of fair value hierarchy.
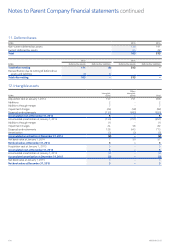
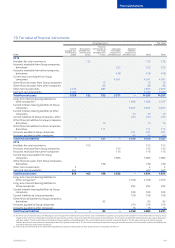
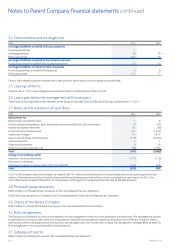
20. Derivative nancial instruments
In 2015, the Company became the centralized external dealing entity in the Group. The Company executes all signicant external derivative
transactions with banks based on the Group’s risk management strategy, and executes identical opposite internal derivative transactions
withGroup Companies as required. Derivative nancial instrument designation to hedging relationships in the table below presents the use
ofand accounting for derivative nancial instruments from the perspective of the Company’s standalone nancial statements, which may
dierfrom the designation in the consolidated nancial statements. Refer to Note 20, Derivative nancial instruments in the consolidated
nancial statements.
EURm
Assets Liabilities
Fair value(1) Notional(2) Fair value(1) Notional(2)
2015
Fair value hedges:
Interest rate swaps 51 300 – –
Cash ow and fair value hedges:(3)
Cross-currency interest rate swaps 17 355 (5) 646
Derivatives not designated in hedge accounting relationships carried at fair value
through prot and loss:
Forward foreign exchange contracts, Group companies 12 1 046 (13) 3 334
Forward foreign exchange contracts 23 3 185 (56) 3 642
Currency options bought 4456 – –
Currency options sold, Group companies – – (3) 286
Currency options sold – – – 162
Interest rate swaps – – (50) 646
Total 107 5 342 (127) 8 716
2014
Fair value hedges:
Interest rate swaps, Group companies 72 378 – –
Cash ow and fair value hedges:(3)
Cross currency interest rate swaps, Group companies 63 382 – –
Derivatives not designated in hedge accounting relationships carried at fair value
through prot and loss:
Forward foreign exchange contracts, Group companies 32 1 694 (62) 2 487
Currency options bought, Group companies –78 – –
Currency options sold, Group companies – – (1) 83
Total 167 2 532 (63) 2 570
(1) Included in other nancial assets and other nancial liabilities in the statement of nancial position.
(2) Includes the gross amount of all notional values for contracts that have not yet been settled or cancelled. The amount of notional value outstanding is not necessarily a measure or indication of market
risk as the exposure of certain contracts may be oset by that of other contracts.
(3) Cross-currency interest rate swaps have been designated partly as fair value hedges and partly as cash ow hedges.
Notes to Parent Company nancial statements continued