Nokia 2015 Annual Report Download - page 10
Download and view the complete annual report
Please find page 10 of the 2015 Nokia annual report below. You can navigate through the pages in the report by either clicking on the pages listed below, or by using the keyword search tool below to find specific information within the annual report.-
 1
1 -
 2
2 -
 3
3 -
 4
4 -
 5
5 -
 6
6 -
 7
7 -
 8
8 -
 9
9 -
 10
10 -
 11
11 -
 12
12 -
 13
13 -
 14
14 -
 15
15 -
 16
16 -
 17
17 -
 18
18 -
 19
19 -
 20
20 -
 21
21 -
22
-
23
-
24
-
25
-
26
-
27
-
28
-
29
-
30
-
31
-
32
-
33
-
34
-
35
-
36
-
37
-
38
-
39
-
40
-
41
-
42
-
43
-
44
-
45
-
46
-
47
-
48
-
49
-
50
-
51
-
52
-
53
-
54
-
55
-
56
-
57
-
58
-
59
-
60
-
61
-
62
-
63
-
64
-
65
-
66
-
67
-
68
-
69
-
70
-
71
-
72
-
73
-
74
-
75
-
76
-
77
-
78
-
79
-
80
-
81
-
82
-
83
-
84
-
85
-
86
-
87
-
88
-
89
-
90
-
91
-
92
-
93
-
94
-
95
-
96
-
97
-
98
-
99
-
100
-
101
-
102
-
103
-
104
-
105
-
106
-
107
-
108
-
109
-
110
-
111
-
112
-
113
-
114
-
115
-
116
-
117
-
118
-
119
-
120
-
121
-
122
-
123
-
124
-
125
-
126
-
127
-
128
-
129
-
130
-
131
-
132
-
133
-
134
-
135
-
136
-
137
-
138
-
139
-
140
-
141
-
142
-
143
-
144
-
145
-
146
-
147
-
148
-
149
-
150
-
151
-
152
-
153
-
154
-
155
-
156
-
157
-
158
-
159
-
160
-
161
-
162
-
163
-
164
-
165
-
166
-
167
-
168
-
169
-
170
-
171
-
172
-
173
-
174
-
175
-
176
-
177
-
178
-
179
-
180
-
181
-
182
-
183
-
184
-
185
-
186
-
187
-
188
-
189
-
190
-
191
-
192
-
193
-
194
-
195
-
196
-
197
-
198
-
199
-
200
-
201
-
202
-
203
-
204
-
205
-
206
-
207
-
208
-
209
-
210
-
211
-
212
-
213
-
214
-
215
-
216
 |
 |

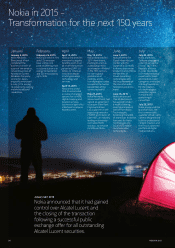
08 NOKIA IN 2015
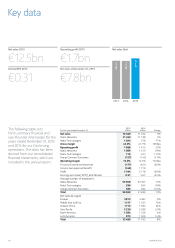
Key data
For the year ended December 31
2015
EURm
2014
EURm Change
Net sales 12 499 11 762 6%
Nokia Networks 11 490 11 198 3%
Nokia Technologies 1 024 578 77%
Gross margin
43.6% 41.7% 190bps
Operating prot 1 688 1 412 20%
Nokia Networks 1 096 1 210 (9)%
Nokia Technologies 719 343 110%
Group Common Functions (127) (142) (11)%
Operating margin
13.5% 12.0% 150bps
Financial income and expenses (177) (401) (56)%
Income tax (expense)/benet (346) 1 719 –
Prot 1 194 2 718 (56)%
Earnings per share (“EPS”), EUR diluted 0.31 0.67 (54)%
Average number of employees
Nokia Networks 55 509 50 557 10%
Nokia Technologies 596 650 (8)%
Group Common Functions 585 292 100%
Total 56 690 51 499 10%
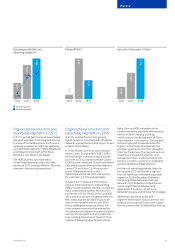
Net sales by region
Europe 3 813 3 493 9%
Middle East & Africa 1 177 1 053 12%
Greater China 1 712 1 380 24%
Asia-Pacic 3 230 3 289 (2)%
North America 1 594 1 538 4%
Latin America 973 1 009 (4)%
Total 12 499 11 762 6%
Net sales 2015
€12.5bn
Operating prot 2015
€1.7bn
Diluted EPS 2015
€0.31
Net cash at December 31, 2015
€ 7.8bn
Net sales (€m)
12 499
11 762
11 795
201320142015
The following table sets
forthsummary nancial and
non-nancial information for the
years ended December 31, 2015
and 2014 for our Continuing
operations. This data has been
derived from our consolidated
nancial statements, which are
included in this annual report.