Nokia 2015 Annual Report Download - page 5
Download and view the complete annual report
Please find page 5 of the 2015 Nokia annual report below. You can navigate through the pages in the report by either clicking on the pages listed below, or by using the keyword search tool below to find specific information within the annual report.-
 1
1 -
 2
2 -
 3
3 -
 4
4 -
 5
5 -
 6
6 -
 7
7 -
 8
8 -
 9
9 -
 10
10 -
 11
11 -
 12
12 -
 13
13 -
 14
14 -
 15
15 -
 16
16 -
17
-
18
-
19
-
20
-
21
-
22
-
23
-
24
-
25
-
26
-
27
-
28
-
29
-
30
-
31
-
32
-
33
-
34
-
35
-
36
-
37
-
38
-
39
-
40
-
41
-
42
-
43
-
44
-
45
-
46
-
47
-
48
-
49
-
50
-
51
-
52
-
53
-
54
-
55
-
56
-
57
-
58
-
59
-
60
-
61
-
62
-
63
-
64
-
65
-
66
-
67
-
68
-
69
-
70
-
71
-
72
-
73
-
74
-
75
-
76
-
77
-
78
-
79
-
80
-
81
-
82
-
83
-
84
-
85
-
86
-
87
-
88
-
89
-
90
-
91
-
92
-
93
-
94
-
95
-
96
-
97
-
98
-
99
-
100
-
101
-
102
-
103
-
104
-
105
-
106
-
107
-
108
-
109
-
110
-
111
-
112
-
113
-
114
-
115
-
116
-
117
-
118
-
119
-
120
-
121
-
122
-
123
-
124
-
125
-
126
-
127
-
128
-
129
-
130
-
131
-
132
-
133
-
134
-
135
-
136
-
137
-
138
-
139
-
140
-
141
-
142
-
143
-
144
-
145
-
146
-
147
-
148
-
149
-
150
-
151
-
152
-
153
-
154
-
155
-
156
-
157
-
158
-
159
-
160
-
161
-
162
-
163
-
164
-
165
-
166
-
167
-
168
-
169
-
170
-
171
-
172
-
173
-
174
-
175
-
176
-
177
-
178
-
179
-
180
-
181
-
182
-
183
-
184
-
185
-
186
-
187
-
188
-
189
-
190
-
191
-
192
-
193
-
194
-
195
-
196
-
197
-
198
-
199
-
200
-
201
-
202
-
203
-
204
-
205
-
206
-
207
-
208
-
209
-
210
-
211
-
212
-
213
-
214
-
215
-
216
 |
 |

Overview
03NOKIA IN 2015
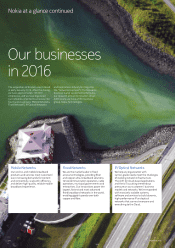
Our businesses in 2015
In 2015, through our Continuing operations,
we had a global presence with operations in
Europe, the Middle East & Africa, Greater
China, North America, Asia-Pacic and Latin
America and research and development
(“R&D”) facilities in Europe, North America
andAsia; and sales in approximately
130countries. We employed approximately
56000 people at the end of 2015.
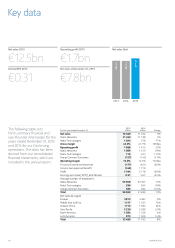
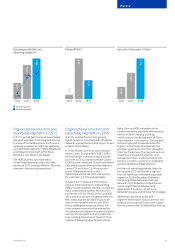
Our Continuing operations delivered net
salesin 2015 of EUR 12.5 billion with strong
underlying protability. We once again made
signicant targeted R&D investments, a
bedrock of our success in innovation, with
R&D expenditures equaling approximately
EUR2.1 billion in 2015.
Net sales 2015 by regionNet sales 2015 by business
1 Nokia Networks €11 490m (+3%)
A Mobile Broadband € 6 064m (0%)
B Global Services € 5 422m (+6%)
2 Nokia Technologies € 1 024m (+77%)
1 Europe(1) € 3 813m (+9%)
2 Middle East & Africa € 1 177m (+12%)
3 Greater China € 1 712m (+24%)
4 Asia-Pacic € 3 230m (-2%)
5 North America € 1 594m (+4%)
6 Latin America € 973m (-4%)
(1) All Nokia Technologies net sales are allocated to Finland.
Year-on-year change is in parentheses.
Derived from our nancial statements which were prepared in accordance with International Financial Reporting Standards, IFRS.
1
A
B
2
1
3
4
5
6
2