Nokia 2015 Annual Report Download - page 139
Download and view the complete annual report
Please find page 139 of the 2015 Nokia annual report below. You can navigate through the pages in the report by either clicking on the pages listed below, or by using the keyword search tool below to find specific information within the annual report.-
 1
1 -
2
-
3
-
4
-
5
-
6
-
7
-
8
-
9
-
10
-
11
-
12
-
13
-
14
-
15
-
16
-
17
-
18
-
19
-
20
-
21
-
22
-
23
-
24
-
25
-
26
-
27
-
28
-
29
-
30
-
31
-
32
-
33
-
34
-
35
-
36
-
37
-
38
-
39
-
40
-
41
-
42
-
43
-
44
-
45
-
46
-
47
-
48
-
49
-
50
-
51
-
52
-
53
-
54
-
55
-
56
-
57
-
58
-
59
-
60
-
61
-
62
-
63
-
64
-
65
-
66
-
67
-
68
-
69
-
70
-
71
-
72
-
73
-
74
-
75
-
76
-
77
-
78
-
79
-
80
-
81
-
82
-
83
-
84
-
85
-
86
-
87
-
88
-
89
-
90
-
91
-
92
-
93
-
94
-
95
-
96
-
97
-
98
-
99
-
100
-
101
-
102
-
103
-
104
-
105
-
106
-
107
-
108
-
109
-
110
-
111
-
112
-
113
-
114
-
115
-
116
-
117
-
118
-
119
-
120
-
121
-
122
-
123
-
124
-
125
-
126
-
127
-
128
-
 129
129 -
 130
130 -
 131
131 -
 132
132 -
 133
133 -
 134
134 -
 135
135 -
 136
136 -
 137
137 -
 138
138 -
 139
139 -
 140
140 -
 141
141 -
 142
142 -
 143
143 -
 144
144 -
 145
145 -
 146
146 -
 147
147 -
 148
148 -
 149
149 -
150
-
151
-
152
-
153
-
154
-
155
-
156
-
157
-
158
-
159
-
160
-
161
-
162
-
163
-
164
-
165
-
166
-
167
-
168
-
169
-
170
-
171
-
172
-
173
-
174
-
175
-
176
-
177
-
178
-
179
-
180
-
181
-
182
-
183
-
184
-
185
-
186
-
187
-
188
-
189
-
190
-
191
-
192
-
193
-
194
-
195
-
196
-
197
-
198
-
199
-
200
-
201
-
202
-
203
-
204
-
205
-
206
-
207
-
208
-
209
-
210
-
211
-
212
-
213
-
214
-
215
-
216
 |
 |

137
Financial statements
NOKIA IN 2015
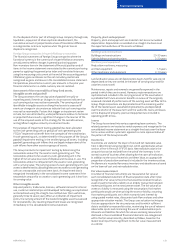
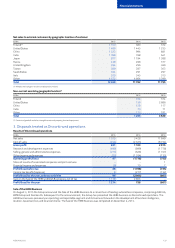
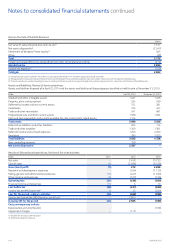
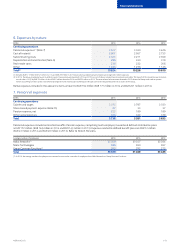
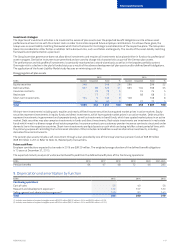
Net sales to external customers by geographic location of customer
EURm 2015 2014 2013
Finland(1) 1 100 680 572
United States 1 489 1 445 1 255
China 1 323 994 881
India 1 098 768 641
Japan 877 1 194 1 388
Russia 438 498 377
United Kingdom 394 296 369
Taiwan 389 387 303
Saudi Arabia 364 291 297
Italy 355 345 313
Other 4 672 4 864 5 399
Total 12 499 11 762 11 795
(1) All Nokia Technologies net sales are allocated to Finland.
Non-current assets by geographic location(1)
EURm 2015 2014
Finland 724 574
United States 159 2 686
China 129 117
India 70 71
Other 173 181
Total 1 255 3 629
(1) Consists of goodwill and other intangible assets and property, plant and equipment.
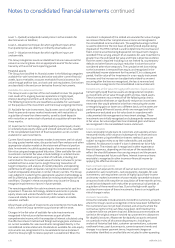
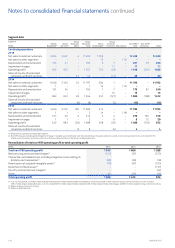
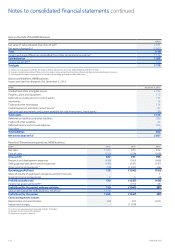
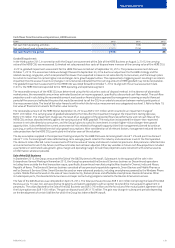
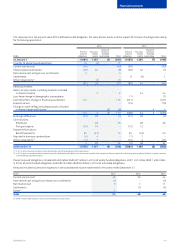
3. Disposals treated as Discontinued operations
Results of Discontinued operations
EURm 2015 2014 2013
Net sales 1 075 3 428 11 649
Cost of sales (244) (2 325) (8 734)
Gross prot 831 1 103 2 915
Research and development expenses (498) (899) (1 778)
Selling, general and administrative expenses (213) (628) (1 747)
Other income and expenses (23) (1 354) (133)
Operating prot/(loss) 97 (1 778) (743)
Share of results of associated companies and joint ventures ––1
Financial income and expenses (9) 10 7
Prot/(loss) before tax 88 (1 768) (735)
Income tax benet/(expense) 8 (277) (132)
Prot/(loss) for the year, ordinary activities 96 (2 045) (867)
Gain on the Sale of the HERE and D&S Businesses, net of tax 1 178 2 803 –
Prot/(loss) for the year 1 274 758 (867)
Sale of the HERE Business
On August 3, 2015 the Group announced the Sale of the HERE Business to a consortium of leading automotive companies, comprising AUDI AG,
BMW Group and Daimler AG. Subsequent to the announcement, the Group has presented the HERE business as Discontinued operations. The
HERE business was previously an operating and reportable segment and its business focused on the development of location intelligence,
location-based services and local commerce. The Sale of the HERE Business was completed on December 4, 2015.