Nokia 2015 Annual Report Download - page 168
Download and view the complete annual report
Please find page 168 of the 2015 Nokia annual report below. You can navigate through the pages in the report by either clicking on the pages listed below, or by using the keyword search tool below to find specific information within the annual report.-
 1
1 -
2
-
3
-
4
-
5
-
6
-
7
-
8
-
9
-
10
-
11
-
12
-
13
-
14
-
15
-
16
-
17
-
18
-
19
-
20
-
21
-
22
-
23
-
24
-
25
-
26
-
27
-
28
-
29
-
30
-
31
-
32
-
33
-
34
-
35
-
36
-
37
-
38
-
39
-
40
-
41
-
42
-
43
-
44
-
45
-
46
-
47
-
48
-
49
-
50
-
51
-
52
-
53
-
54
-
55
-
56
-
57
-
58
-
59
-
60
-
61
-
62
-
63
-
64
-
65
-
66
-
67
-
68
-
69
-
70
-
71
-
72
-
73
-
74
-
75
-
76
-
77
-
78
-
79
-
80
-
81
-
82
-
83
-
84
-
85
-
86
-
87
-
88
-
89
-
90
-
91
-
92
-
93
-
94
-
95
-
96
-
97
-
98
-
99
-
100
-
101
-
102
-
103
-
104
-
105
-
106
-
107
-
108
-
109
-
110
-
111
-
112
-
113
-
114
-
115
-
116
-
117
-
118
-
119
-
120
-
121
-
122
-
123
-
124
-
125
-
126
-
127
-
128
-
129
-
130
-
131
-
132
-
133
-
134
-
135
-
136
-
137
-
138
-
139
-
140
-
141
-
142
-
143
-
144
-
145
-
146
-
147
-
148
-
149
-
150
-
151
-
152
-
153
-
154
-
155
-
156
-
157
-
 158
158 -
 159
159 -
 160
160 -
 161
161 -
 162
162 -
 163
163 -
 164
164 -
 165
165 -
 166
166 -
 167
167 -
 168
168 -
 169
169 -
 170
170 -
 171
171 -
 172
172 -
 173
173 -
 174
174 -
 175
175 -
 176
176 -
 177
177 -
 178
178 -
179
-
180
-
181
-
182
-
183
-
184
-
185
-
186
-
187
-
188
-
189
-
190
-
191
-
192
-
193
-
194
-
195
-
196
-
197
-
198
-
199
-
200
-
201
-
202
-
203
-
204
-
205
-
206
-
207
-
208
-
209
-
210
-
211
-
212
-
213
-
214
-
215
-
216
 |
 |

166 NOKIA IN 2015
Notes to consolidated nancial statements continued
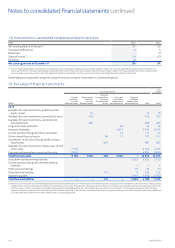
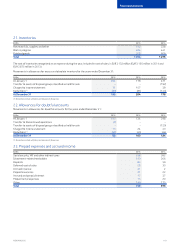
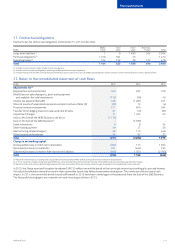
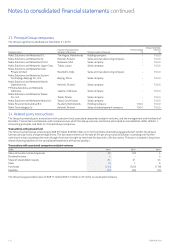
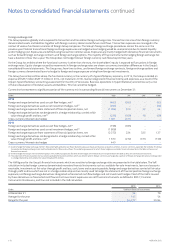
Reconciliation of stock options outstanding and exercisable:
Shares under option(1)
Number
of shares
Weighted
average exercise
price
EUR
Weighted
average share
price
EUR
Weighted
average grant
date fair value
EUR(2)
Number of
options
exercisable
Weighted
average exercise
price
EUR
At January 1, 2013 25 846 368 5.95 5 616 112 11.96
Granted 8 334 200 2.77 1.23
Forfeited (3 705 512) 4.06
Expired (2 474 864) 14.78
At December 31, 2013 28 000 192 4.47 4 339 341 9.66
Exercised (56 623) 5.75 6.69
Forfeited (16 839 593) 3.39
Expired (3 759 953) 9.94
At December 31, 2014 7 344 023 4.81 1 913 537 10.43
Exercised (1 242 381) 3.79 6.44
Forfeited (2 215 216) 2.48
Expired (246 140) 8.07
At December 31, 2015 3 640 286 4.67 2 318 911 5.97
(1) Includes stock options granted under other than global equity plans, excluding the Nokia Networks Equity Incentive Plan.
(2) Fair value of stock options is calculated using the Black-Scholes model.
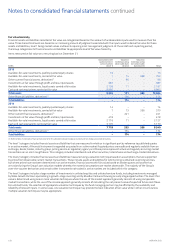
Nokia Networks equity incentive plan
Nokia Networks established in 2012 the Nokia Networks Equity Incentive Plan (”the Plan”), a share-based incentive program under which options
for Nokia Solutions and Networks B.V. shares were granted to selected key employees and Nokia Networks’ senior management, some of
whombecame members of the Group Leadership Team in 2014. Following the Group’s acquisition of Siemens’ stake in Nokia Networks and the
Sale of the D&S Business, the Board of Directors approved a modication to the Plan in 2014 to allow 30% of the options to vest on the third
anniversary of the grant date, with the remainder of the options continuing to become exercisable on the fourth anniversary of the grant date,
or earlier, in the event of a corporate transaction as dened in the Plan. The exercise price of the options is based on a per share value on grant
as determined for the purposes of the Plan. The options are accounted for as a cash-settled share-based payment liability at December 31,
2015. The fair value of the liability is determined based on the estimated fair value of shares less the exercise price of the options on the
reporting date. The total carrying amount of the Plan is EUR 73 million (EUR 80 million in 2014) and is included in accrued expenses and other
liabilities in the consolidated statement of nancialposition.
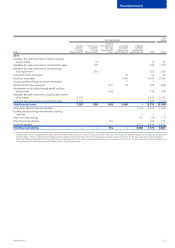
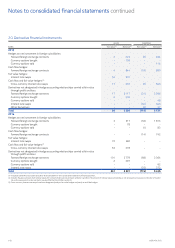
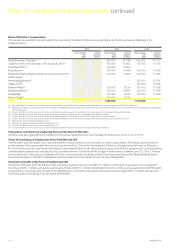
26. Translation dierences
EURm
Translation differences Net investment hedging Total
Gross Tax Net Gross Tax Net Gross Tax Net
At January 1, 2013 961 3964 (269) 51 (218) 692 54 746
Exchange dierences on translating
foreignoperations (496) (496) –(496) –(496)
Net investment hedging gains –114 114 114 –114
Acquisition of non-controlling interests 42 42 –42 –42
Movements attributable to non-controlling interests 28 28 –28 –28
At December 31, 2013 535 3538 (155) 51 (104) 380 54 434
Exchange dierences on translating
foreignoperations 628 628 –628 –628
Transfer to income statement(1) 192 192 –192 –192
Net investment hedging losses –(187) 34 (153) (187) 34 (153)
Transfer to income statement(1) –20 (15) 5 20 (15) 5
Movements attributable to non-controlling interests (7) (7) –(7) –(7)
At December 31, 2014 1 348 31 351 (322) 70 (252) 1 026 73 1 099
Exchange dierences on translating
foreignoperations 671 1 672 – 671 1 672
Transfer to income statement(2) (1 727) (1 727) – (1 727) – (1 727)
Net investment hedging losses –(260) 53 (207) (260) 53 (207)
Transfer to income statement(2) – 582 (123) 459 582 (123) 459
Movements attributable to non-controlling interests (4) (4) –(4) –(4)
At December 31, 2015 288 4 292 – – – 288 4 292
(1) Reclassied from other comprehensive income to the consolidated income statement primarily due to the Sale of the D&S Business.
(2) Reclassied from other comprehensive income to the consolidated income statement primarily due to the Sale of the HERE Business.