Nokia 2015 Annual Report Download - page 194
Download and view the complete annual report
Please find page 194 of the 2015 Nokia annual report below. You can navigate through the pages in the report by either clicking on the pages listed below, or by using the keyword search tool below to find specific information within the annual report.-
 1
1 -
2
-
3
-
4
-
5
-
6
-
7
-
8
-
9
-
10
-
11
-
12
-
13
-
14
-
15
-
16
-
17
-
18
-
19
-
20
-
21
-
22
-
23
-
24
-
25
-
26
-
27
-
28
-
29
-
30
-
31
-
32
-
33
-
34
-
35
-
36
-
37
-
38
-
39
-
40
-
41
-
42
-
43
-
44
-
45
-
46
-
47
-
48
-
49
-
50
-
51
-
52
-
53
-
54
-
55
-
56
-
57
-
58
-
59
-
60
-
61
-
62
-
63
-
64
-
65
-
66
-
67
-
68
-
69
-
70
-
71
-
72
-
73
-
74
-
75
-
76
-
77
-
78
-
79
-
80
-
81
-
82
-
83
-
84
-
85
-
86
-
87
-
88
-
89
-
90
-
91
-
92
-
93
-
94
-
95
-
96
-
97
-
98
-
99
-
100
-
101
-
102
-
103
-
104
-
105
-
106
-
107
-
108
-
109
-
110
-
111
-
112
-
113
-
114
-
115
-
116
-
117
-
118
-
119
-
120
-
121
-
122
-
123
-
124
-
125
-
126
-
127
-
128
-
129
-
130
-
131
-
132
-
133
-
134
-
135
-
136
-
137
-
138
-
139
-
140
-
141
-
142
-
143
-
144
-
145
-
146
-
147
-
148
-
149
-
150
-
151
-
152
-
153
-
154
-
155
-
156
-
157
-
158
-
159
-
160
-
161
-
162
-
163
-
164
-
165
-
166
-
167
-
168
-
169
-
170
-
171
-
172
-
173
-
174
-
175
-
176
-
177
-
178
-
179
-
180
-
181
-
182
-
183
-
 184
184 -
 185
185 -
 186
186 -
 187
187 -
 188
188 -
 189
189 -
 190
190 -
 191
191 -
 192
192 -
 193
193 -
 194
194 -
 195
195 -
 196
196 -
 197
197 -
 198
198 -
 199
199 -
 200
200 -
 201
201 -
 202
202 -
 203
203 -
 204
204 -
205
-
206
-
207
-
208
-
209
-
210
-
211
-
212
-
213
-
214
-
215
-
216
 |
 |

192 NOKIA IN 2015
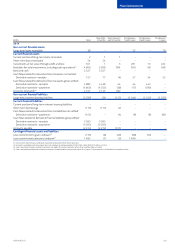
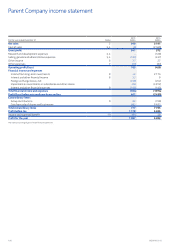
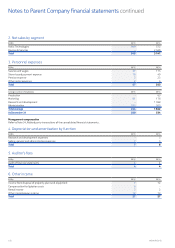
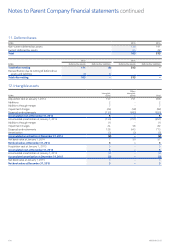
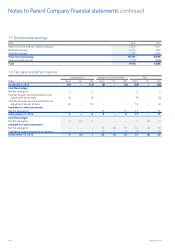
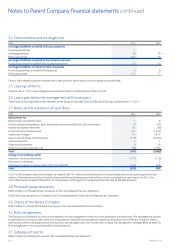
2. Net sales by segment
EURm 2015 2014
Nokia Technologies 949 572
Devices & Services –2 569
Total 949 3 141
3. Personnel expenses
EURm 2015 2014
Salaries and wages 37 175
Share-based payment expense 16 49
Pension expense 223
Other social expenses 26
Total 57 253
Average number of employees 2015 2014
Production –63
Marketing 61 176
Research and development –1 098
Administration 183 505
Total average 244 1 842
At December 31 280 534
Management compensation
Refer to Note 34, Related party transactions of the consolidated nancial statements.
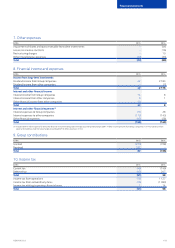
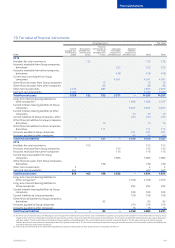
4. Depreciation and amortization by function
EURm 2015 2014
Research and development expenses –3
Selling, general and administrative expenses 75
Total 78
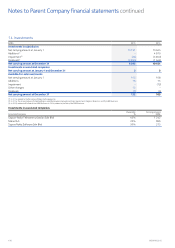
5. Auditor’s fees
EURm 2015 2014
Audit of nancial statements 44
Total 44
6. Other income
EURm 2015 2014
Income from disposal of property, plant and equipment 712
Compensation for ligitation costs 6 –
Rental income 22
Other miscellaneous income 12 13
Total 27 27
Notes to Parent Company nancial statements continued