Nokia 2015 Annual Report Download - page 177
Download and view the complete annual report
Please find page 177 of the 2015 Nokia annual report below. You can navigate through the pages in the report by either clicking on the pages listed below, or by using the keyword search tool below to find specific information within the annual report.-
 1
1 -
2
-
3
-
4
-
5
-
6
-
7
-
8
-
9
-
10
-
11
-
12
-
13
-
14
-
15
-
16
-
17
-
18
-
19
-
20
-
21
-
22
-
23
-
24
-
25
-
26
-
27
-
28
-
29
-
30
-
31
-
32
-
33
-
34
-
35
-
36
-
37
-
38
-
39
-
40
-
41
-
42
-
43
-
44
-
45
-
46
-
47
-
48
-
49
-
50
-
51
-
52
-
53
-
54
-
55
-
56
-
57
-
58
-
59
-
60
-
61
-
62
-
63
-
64
-
65
-
66
-
67
-
68
-
69
-
70
-
71
-
72
-
73
-
74
-
75
-
76
-
77
-
78
-
79
-
80
-
81
-
82
-
83
-
84
-
85
-
86
-
87
-
88
-
89
-
90
-
91
-
92
-
93
-
94
-
95
-
96
-
97
-
98
-
99
-
100
-
101
-
102
-
103
-
104
-
105
-
106
-
107
-
108
-
109
-
110
-
111
-
112
-
113
-
114
-
115
-
116
-
117
-
118
-
119
-
120
-
121
-
122
-
123
-
124
-
125
-
126
-
127
-
128
-
129
-
130
-
131
-
132
-
133
-
134
-
135
-
136
-
137
-
138
-
139
-
140
-
141
-
142
-
143
-
144
-
145
-
146
-
147
-
148
-
149
-
150
-
151
-
152
-
153
-
154
-
155
-
156
-
157
-
158
-
159
-
160
-
161
-
162
-
163
-
164
-
165
-
166
-
 167
167 -
 168
168 -
 169
169 -
 170
170 -
 171
171 -
 172
172 -
 173
173 -
 174
174 -
 175
175 -
 176
176 -
 177
177 -
 178
178 -
 179
179 -
 180
180 -
 181
181 -
 182
182 -
 183
183 -
 184
184 -
 185
185 -
 186
186 -
 187
187 -
188
-
189
-
190
-
191
-
192
-
193
-
194
-
195
-
196
-
197
-
198
-
199
-
200
-
201
-
202
-
203
-
204
-
205
-
206
-
207
-
208
-
209
-
210
-
211
-
212
-
213
-
214
-
215
-
216
 |
 |

175
Financial statements
NOKIA IN 2015
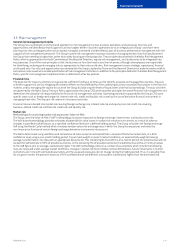
35. Risk management
General risk management principles
The Group has a systematic and structured approach to risk management across business operations and processes. Key risks and
opportunities are identied primarily against business targets either in business operations or as an integral part of long- and short-term
planning. Keyrisks and opportunities are analyzed, managed, monitored and identied as part of business performance management with the
support ofrisk management personnel. The Group’s overall risk management concept is based on managing the key risks that would prevent
the Group from meeting its objectives, rather than solely focusing on eliminating risks. The principles documented in the Nokia Risk Management
Policy, which is approved by the Audit Committee of the Board of Directors, require risk management, and its elements to be integrated into
keyprocesses. One of the main principles is that the business or function head is also the risk owner, although all employees are responsible
foridentifying, analyzing and managing risks as appropriate to their roles and duties. Risk management covers strategic, operational, nancial
and hazard risks. Key risks and opportunities are reviewed by the Group Leadership Team and the Board of Directors in order to create visibility
onbusiness risks as well as to enable prioritization of risk management activities. In addition to the principles dened in the Nokia Risk Management
Policy, specic risk management implementation is reected in other key policies.
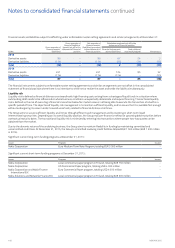
Financial risks
The objective for treasury activities is to guarantee sucient funding at all times and to identify, evaluate and manage nancial risks. Treasury
activities support this aim by mitigating the adverse eects on the protability of the underlying business caused by uctuations in the nancial
markets, and by managing the capital structure of the Group by balancing the levels of liquid assets and nancial borrowings. Treasury activities
are governed by the Nokia Group Treasury Policy approved by the Group CEO which provides principles for overall nancial risk management and
determines the allocation of responsibilities for nancial risk management activities. Operating procedures approved by the Group CFO cover
specic areas such as foreign exchange risk, interest rate risk, credit and liquidity risk as well as the use of derivative nancial instruments in
managing these risks. The Group is risk-averse in its treasury activities.
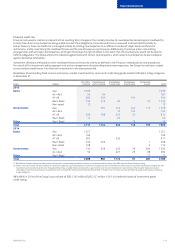
Financial risks are divided into market risk covering foreign exchange risk, interest rate risk and equity price risk; credit risk covering
business-related credit risk and nancial credit risk; and liquidity risk.
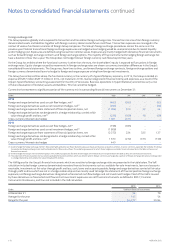
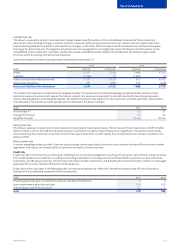
Market risk
Methodology for assessing market risk exposures: Value-at-Risk
The Group uses the Value-at-Risk (“VaR”) methodology to assess exposures to foreign exchange, interest rate, and equity price risks.
The VaR-based methodology provides estimates of potential fair value losses in market risk-sensitive instruments as a result of adverse
changes in specied market factors, at a specied condence level over a dened holding period. The Group calculates the foreign exchange
VaR using theMonte Carlo method which simulates random values for exchange rates in which the Group has exposures and takes the
non-linear price function of certain foreign exchange derivative instruments into account.
The VaR is determined using volatilities and correlations of rates and prices estimated from a sample of historical market data, at a 95%
condence level, using a one-month holding period. To put more weight on recent market conditions, an exponentially weighted moving
average is performed on the data with an appropriate decay factor. This model implies that within a one-month period, the potential loss will not
exceed the VaR estimate in 95% of possible outcomes. In the remaining 5% of possible outcomes the potential loss will be at minimum equal
tothe VaR gure and, on average, substantially higher. The VaR methodology relies on a number of assumptions which include the following:
risks are measured under average market conditions, changes in market risk factors follow normal distributions, future movements in market
risk factors are in line with estimated parameters and the assessed exposures do not change during the holding period. Thus, it is possible that,
for any given month, the potential losses at a 95% condence level are dierent and could be substantially higher than the estimated VaR.