Nokia 2015 Annual Report Download - page 179
Download and view the complete annual report
Please find page 179 of the 2015 Nokia annual report below. You can navigate through the pages in the report by either clicking on the pages listed below, or by using the keyword search tool below to find specific information within the annual report.-
 1
1 -
2
-
3
-
4
-
5
-
6
-
7
-
8
-
9
-
10
-
11
-
12
-
13
-
14
-
15
-
16
-
17
-
18
-
19
-
20
-
21
-
22
-
23
-
24
-
25
-
26
-
27
-
28
-
29
-
30
-
31
-
32
-
33
-
34
-
35
-
36
-
37
-
38
-
39
-
40
-
41
-
42
-
43
-
44
-
45
-
46
-
47
-
48
-
49
-
50
-
51
-
52
-
53
-
54
-
55
-
56
-
57
-
58
-
59
-
60
-
61
-
62
-
63
-
64
-
65
-
66
-
67
-
68
-
69
-
70
-
71
-
72
-
73
-
74
-
75
-
76
-
77
-
78
-
79
-
80
-
81
-
82
-
83
-
84
-
85
-
86
-
87
-
88
-
89
-
90
-
91
-
92
-
93
-
94
-
95
-
96
-
97
-
98
-
99
-
100
-
101
-
102
-
103
-
104
-
105
-
106
-
107
-
108
-
109
-
110
-
111
-
112
-
113
-
114
-
115
-
116
-
117
-
118
-
119
-
120
-
121
-
122
-
123
-
124
-
125
-
126
-
127
-
128
-
129
-
130
-
131
-
132
-
133
-
134
-
135
-
136
-
137
-
138
-
139
-
140
-
141
-
142
-
143
-
144
-
145
-
146
-
147
-
148
-
149
-
150
-
151
-
152
-
153
-
154
-
155
-
156
-
157
-
158
-
159
-
160
-
161
-
162
-
163
-
164
-
165
-
166
-
167
-
168
-
 169
169 -
 170
170 -
 171
171 -
 172
172 -
 173
173 -
 174
174 -
 175
175 -
 176
176 -
 177
177 -
 178
178 -
 179
179 -
 180
180 -
 181
181 -
 182
182 -
 183
183 -
 184
184 -
 185
185 -
 186
186 -
 187
187 -
 188
188 -
 189
189 -
190
-
191
-
192
-
193
-
194
-
195
-
196
-
197
-
198
-
199
-
200
-
201
-
202
-
203
-
204
-
205
-
206
-
207
-
208
-
209
-
210
-
211
-
212
-
213
-
214
-
215
-
216
 |
 |

177
Financial statements
NOKIA IN 2015
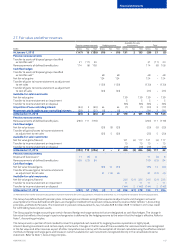
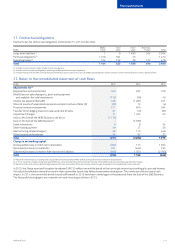
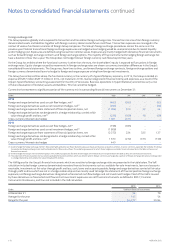
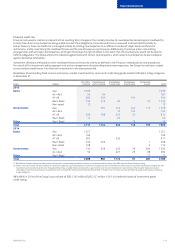
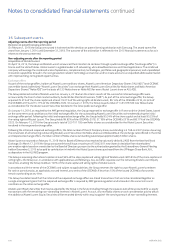
Interest rate risk
The Group is exposed to interest rate risk either through market value uctuations of the consolidated statement of nancial position
items(price risk) or through changes in interest income or expenses (renancing or reinvestment risk). Interest rate risk mainly arises from
interest-bearing liabilities and assets. Estimated future changes in cash ows and the statement of nancial position structure also expose
theGroup to interest rate risk. The objective of interest rate risk management is to mitigate the impact of interest rate uctuations on the
consolidated income statement, cash ow, and nancial assets and liabilities whilst taking into consideration the Group’s target capital
structureand the resulting net interest rate exposure.
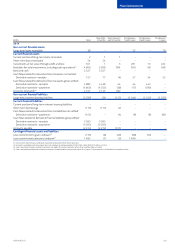
Interest rate prole of interest-bearing assets and liabilities at December 31:
EURm
2015 2014
Fixed rate Floating rate Fixed rate Floating rate
Assets 3 721 6 160 3 494 4 243
Liabilities (2 068) (1) (2 681) (1)
Assets and liabilities before derivatives 1 653 6 159 813 4 242
Interest rate derivatives 981 (986) 552 (469)
Assets and liabilities after derivatives 2 634 5 173 1 365 3 773
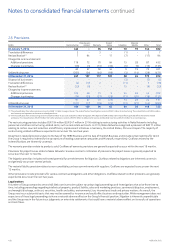
The interest rate exposure is monitored and managed centrally. The Group uses the VaR methodology complemented by selective shock
sensitivity analyses to assess and measure the Group’s interest rate exposure comprising the interest rate risk of interest-bearing assets,
interest-bearing liabilities and related derivatives. The VaR for the interest rate exposure in the investment and debt portfolios is presented in
the table below. Sensitivities to credit spreads are not reected in the below numbers.
EURm 2015 2014
At December 31 23 31
Average for the year 29 32
Range for the year 23–36 25–54
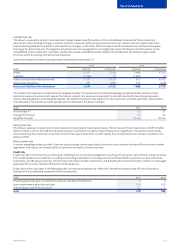
Equity price risk
The Group’s exposure to equity price risk is related to certain publicly listed equity shares. The fair value of these investments is EUR 16 million
(EUR 12 million in 2014). The VaR for the Group’s equity investments in publicly traded companies is insignicant. The private venture funds
where the Group has investments may, from time to time, have investments in public equity. Such investments have not been included in the
above number.
Other market risk
In certain emerging market countries, there are local exchange control regulations that restrict cross-border transfers of funds as well as other
regulations that impact the Group’s ability to control its net assets in those countries.
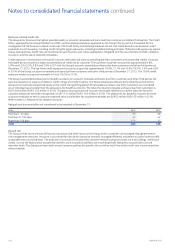
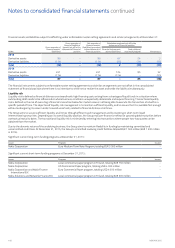
Credit risk
Credit risk refers to the risk that a counterparty will default on its contractual obligations resulting in nancial loss to the Group. Credit risk arises
from credit exposures to customers, including outstanding receivables, nancial guarantees and committed transactions, as well as nancial
institutions, including bank and cash, xed-income and money-market investments, and derivative nancial instruments. Credit risk is managed
separately for business-related and nancial credit exposures.
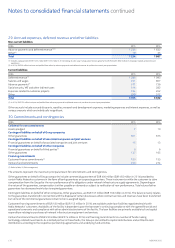
Except for the rst two items in the following table, the maximum exposure to credit risk is limited to the book value of nancial assets as
included in the consolidated statement of nancial position:
EURm 2015 2014
Financial guarantees given on behalf of customers and other third parties 66
Loan commitments given but not used 180 155
Outstanding customer nance loans 33 1
Total 219 162