Nokia 2015 Annual Report Download - page 53
Download and view the complete annual report
Please find page 53 of the 2015 Nokia annual report below. You can navigate through the pages in the report by either clicking on the pages listed below, or by using the keyword search tool below to find specific information within the annual report.-
 1
1 -
2
-
3
-
4
-
5
-
6
-
7
-
8
-
9
-
10
-
11
-
12
-
13
-
14
-
15
-
16
-
17
-
18
-
19
-
20
-
21
-
22
-
23
-
24
-
25
-
26
-
27
-
28
-
29
-
30
-
31
-
32
-
33
-
34
-
35
-
36
-
37
-
38
-
39
-
40
-
41
-
42
-
 43
43 -
 44
44 -
 45
45 -
 46
46 -
 47
47 -
 48
48 -
 49
49 -
 50
50 -
 51
51 -
 52
52 -
 53
53 -
 54
54 -
 55
55 -
 56
56 -
 57
57 -
 58
58 -
 59
59 -
 60
60 -
 61
61 -
 62
62 -
 63
63 -
64
-
65
-
66
-
67
-
68
-
69
-
70
-
71
-
72
-
73
-
74
-
75
-
76
-
77
-
78
-
79
-
80
-
81
-
82
-
83
-
84
-
85
-
86
-
87
-
88
-
89
-
90
-
91
-
92
-
93
-
94
-
95
-
96
-
97
-
98
-
99
-
100
-
101
-
102
-
103
-
104
-
105
-
106
-
107
-
108
-
109
-
110
-
111
-
112
-
113
-
114
-
115
-
116
-
117
-
118
-
119
-
120
-
121
-
122
-
123
-
124
-
125
-
126
-
127
-
128
-
129
-
130
-
131
-
132
-
133
-
134
-
135
-
136
-
137
-
138
-
139
-
140
-
141
-
142
-
143
-
144
-
145
-
146
-
147
-
148
-
149
-
150
-
151
-
152
-
153
-
154
-
155
-
156
-
157
-
158
-
159
-
160
-
161
-
162
-
163
-
164
-
165
-
166
-
167
-
168
-
169
-
170
-
171
-
172
-
173
-
174
-
175
-
176
-
177
-
178
-
179
-
180
-
181
-
182
-
183
-
184
-
185
-
186
-
187
-
188
-
189
-
190
-
191
-
192
-
193
-
194
-
195
-
196
-
197
-
198
-
199
-
200
-
201
-
202
-
203
-
204
-
205
-
206
-
207
-
208
-
209
-
210
-
211
-
212
-
213
-
214
-
215
-
216
 |
 |

51
Board review
NOKIA IN 2015
Discontinued operations
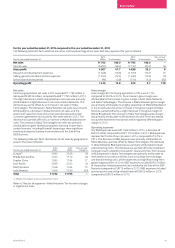
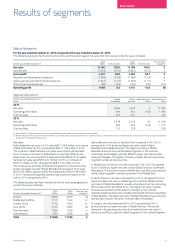
For the year ended December 31, 2015 compared to the year ended December 31, 2014
As the Sale of the HERE Business closed on December 4, 2015 and the Sale of the D&S Business closed on April 25, 2014, the nancial results
ofDiscontinued operations in 2015 are not comparable to the nancial results of Discontinued operations in 2014.
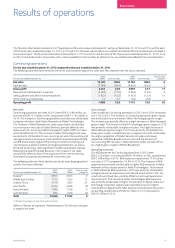
The following table sets forth selective line items and the percentage of net sales that they represent for the years indicated.
For the year ended December 31
2015
EURm % of net sales
2014
EURm % of net sales
Year-on-year
change %
Net sales 1 075 100.0 3 428 100.0 (69)
Cost of sales (244) (22.7) (2 325) (67.8) (90)
Gross prot 831 77.3 1 103 32.2 (25)
Research and development expenses (498) (46.3) (899) (26.2) (45)
Selling, general and administrative expenses (213) (19.8) (628) (18.3) (66)
Other income and expenses(1) (23) (2.1) (1 354) (39.5) (98)
Operating prot/(loss) 97 9.0 (1 778) (51.9) –
(1) Includes impairment of goodwill of EUR 1 209 million related to HERE in 2014.
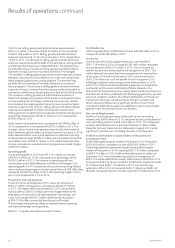
Net sales
Discontinued operations net sales in 2015 were EUR 1 075 million, a
decrease of EUR 2 353 million, or 69%, compared to EUR 3 428 million
in 2014. The decrease was attributable to the absence of net sales
from Devices and Services.
Gross margin
Discontinued operations gross margin in 2015 was 77.3%, compared
to a gross margin of 32.2% in 2014. The increase in gross margin was
attributable to the absence of cost of sales from Devices and Services.
Operating expenses
Discontinued operations operating expenses in 2015 were
EUR 734 million, a decrease of EUR 2 147 million, or 74.5%, compared
to EUR2 881 million in 2014. The decrease was primarily attributable
to the absence of a EUR 1 209 million impairment charge related to
HERE which negatively aected 2014, and lower operating expenses
attributable to Devices & Services.
Operating prot/loss
Discontinued operations operating prot in 2015 was EUR 97 million,
an increase of EUR 1 875 million, compared to an operating loss of
EUR1 778 million in 2014. The change in Discontinued operations
operating result was primarily attributable to the absence of a
EUR1209 million impairment charge related to HERE which negatively
aected 2014, and lower operating expenses attributable to Devices
& Services, partially oset by lower gross prot.
Prot for the year
Discontinued operations prot in 2015 was EUR 1 274 million, an
increase of EUR 516 million compared to a prot of EUR 758 million
in2014. The gain on the Sale of the HERE Business recorded in
2015was EUR 1 178 million, which included a reclassication of
EUR 1 174 million of foreign exchange dierences from other
comprehensive income. The gain on the Sale of the D&S Business
recorded in 2014 was EUR 2 803 million.