Nokia 2015 Annual Report Download - page 178
Download and view the complete annual report
Please find page 178 of the 2015 Nokia annual report below. You can navigate through the pages in the report by either clicking on the pages listed below, or by using the keyword search tool below to find specific information within the annual report.-
 1
1 -
2
-
3
-
4
-
5
-
6
-
7
-
8
-
9
-
10
-
11
-
12
-
13
-
14
-
15
-
16
-
17
-
18
-
19
-
20
-
21
-
22
-
23
-
24
-
25
-
26
-
27
-
28
-
29
-
30
-
31
-
32
-
33
-
34
-
35
-
36
-
37
-
38
-
39
-
40
-
41
-
42
-
43
-
44
-
45
-
46
-
47
-
48
-
49
-
50
-
51
-
52
-
53
-
54
-
55
-
56
-
57
-
58
-
59
-
60
-
61
-
62
-
63
-
64
-
65
-
66
-
67
-
68
-
69
-
70
-
71
-
72
-
73
-
74
-
75
-
76
-
77
-
78
-
79
-
80
-
81
-
82
-
83
-
84
-
85
-
86
-
87
-
88
-
89
-
90
-
91
-
92
-
93
-
94
-
95
-
96
-
97
-
98
-
99
-
100
-
101
-
102
-
103
-
104
-
105
-
106
-
107
-
108
-
109
-
110
-
111
-
112
-
113
-
114
-
115
-
116
-
117
-
118
-
119
-
120
-
121
-
122
-
123
-
124
-
125
-
126
-
127
-
128
-
129
-
130
-
131
-
132
-
133
-
134
-
135
-
136
-
137
-
138
-
139
-
140
-
141
-
142
-
143
-
144
-
145
-
146
-
147
-
148
-
149
-
150
-
151
-
152
-
153
-
154
-
155
-
156
-
157
-
158
-
159
-
160
-
161
-
162
-
163
-
164
-
165
-
166
-
167
-
 168
168 -
 169
169 -
 170
170 -
 171
171 -
 172
172 -
 173
173 -
 174
174 -
 175
175 -
 176
176 -
 177
177 -
 178
178 -
 179
179 -
 180
180 -
 181
181 -
 182
182 -
 183
183 -
 184
184 -
 185
185 -
 186
186 -
 187
187 -
 188
188 -
189
-
190
-
191
-
192
-
193
-
194
-
195
-
196
-
197
-
198
-
199
-
200
-
201
-
202
-
203
-
204
-
205
-
206
-
207
-
208
-
209
-
210
-
211
-
212
-
213
-
214
-
215
-
216
 |
 |

176 NOKIA IN 2015
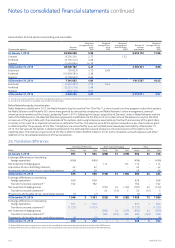
Notes to consolidated nancial statements continued
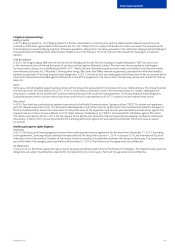
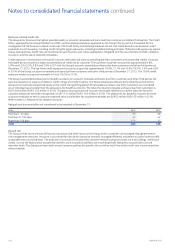
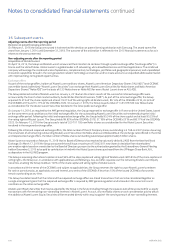
Foreign exchange risk
The Group operates globally and is exposed to transaction and translation foreign exchange risks. Transaction risk arises from foreign currency
denominated assets and liabilities together with foreign currency denominated future cash ows. Transaction exposures are managed in the
context of various functional currencies of foreign Group companies. The Group’s foreign exchange procedures remain the same as in the
previous year. Material transactional foreign exchange exposures are hedged unless hedging would be uneconomical due to market liquidity
and/or hedging cost. Exposures are dened using transaction nominal values. Exposures are mainly hedged with derivative nancial instruments
such as forward foreign exchange contracts and foreign exchange options. The majority of nancial instruments hedging foreign exchange risk
have a duration of less than a year. The Group does not hedge forecast foreign currency cash ows beyond two years.
As the Group has entities where the functional currency is other than the euro, the shareholders’ equity is exposed to uctuations in foreign
exchange rates. Equity changes caused by movements in foreign exchange rates are shown as currency translation dierences in the Group’s
consolidated nancial statements. The Group may, from time to time, use forward foreign exchange contracts, foreign exchange options and
foreign currency denominated loans to hedge its foreign exchange exposure arising from foreign net investments.
The Group has certain entities where the functional currency is the currency of a hyperinationary economy. In 2015, the Group recorded an
expense of EUR 7 million (EUR 17 million in 2014, not material in 2013), mainly recognized in nancial income and expenses, as a result of the
Group’s hyperinationary accounting assessment for its entity in Venezuela. Business operations in hyperinationary economies carry a risk
offuture devaluation of monetary assets and liabilities. This risk cannot be hedged.
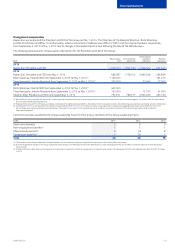
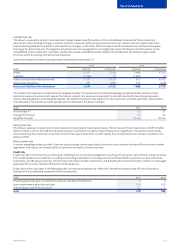
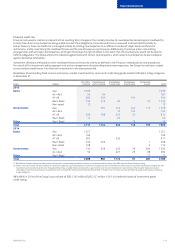
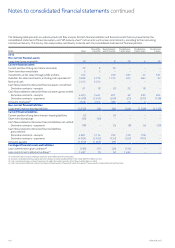
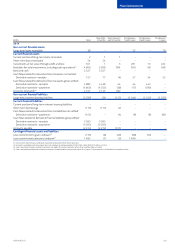
Currencies that represent a signicant portion of the currency mix in outstanding nancial instruments at December 31:
EURm USD JPY CNY KRW
2015
Foreign exchange derivatives used as cash ow hedges, net(1) (465) (262) –(63)
Foreign exchange derivatives used as net investment hedges, net(2) (296) – – (24)
Foreign exchange exposure from statement of nancial position items, net (1 004) 910 32 44
Foreign exchange derivatives not designated in a hedge relationship, carried at fair
value through prot and loss, net(3) (226) (559) 18 (59)
Cross-currency/interest rate hedges 1 001 (311) – –
2014
Foreign exchange derivatives used as cash ow hedges, net(1) (198) (365) – –
Foreign exchange derivatives used as net investment hedges, net(2) (1 808) – – –
Foreign exchange exposure from statement of nancial position items, net (2 272) 224 325 127
Foreign exchange derivatives not designated in a hedge relationship, carried at fair
value through prot and loss, net(3) 1 670 (272) (371) (159)
Cross-currency/interest rate hedges 440 –––
(1) Used to hedge the foreign exchange risk from forecasted highly probable cash ows related to sales, purchases and business acquisition activities. In some currencies, especially the US dollar, the Group
has substantial foreign exchange risks in both estimated cash inows and outows. The underlying exposures for which these hedges are entered into are not presented in the table as they are not
nancial instruments.
(2) Used to hedge the Group’s net investment exposure. The underlying exposures for which these hedges are entered into are not presented in the table as they are not nancial instruments.
(3) The statement of nancial position items and some probable forecasted cash ows which are denominated in foreign currencies are hedged by a portion of foreign exchange derivatives not designated
in a hedge relationship and carried at fair value through prot and loss.
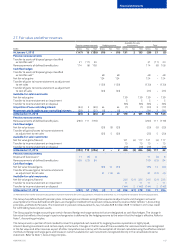
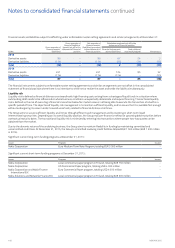
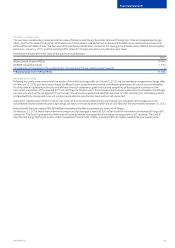
The VaR gures for the Group’s nancial instruments which are sensitive to foreign exchange risks are presented in the table below. The VaR
calculation includes foreign currency denominated monetary nancial instruments such as: available-for-sale investments, loans and accounts
receivable, investments at fair value through prot and loss, cash, loans and accounts payable; foreign exchange derivatives carried at fair value
through prot and loss which are not in a hedge relationship and are mostly used to hedge the statement of nancial position foreign exchange
exposure; and foreign exchange derivatives designated as forecasted cash ow hedges and net investment hedges. Most of the VaR is caused
by these derivatives as forecasted cash ow and net investment exposures are not nancial instruments as dened in IFRS 7, Financial
Instruments: Disclosures, and thus not included in the VaR calculation.
EURm
2015 2014
VaR from financial instruments
At December 31 54 79
Average for the year 145 54
Range for the year 54–217 30–94