Nokia 2015 Annual Report Download - page 59
Download and view the complete annual report
Please find page 59 of the 2015 Nokia annual report below. You can navigate through the pages in the report by either clicking on the pages listed below, or by using the keyword search tool below to find specific information within the annual report.-
 1
1 -
2
-
3
-
4
-
5
-
6
-
7
-
8
-
9
-
10
-
11
-
12
-
13
-
14
-
15
-
16
-
17
-
18
-
19
-
20
-
21
-
22
-
23
-
24
-
25
-
26
-
27
-
28
-
29
-
30
-
31
-
32
-
33
-
34
-
35
-
36
-
37
-
38
-
39
-
40
-
41
-
42
-
43
-
44
-
45
-
46
-
47
-
48
-
 49
49 -
 50
50 -
 51
51 -
 52
52 -
 53
53 -
 54
54 -
 55
55 -
 56
56 -
 57
57 -
 58
58 -
 59
59 -
 60
60 -
 61
61 -
 62
62 -
 63
63 -
 64
64 -
 65
65 -
 66
66 -
 67
67 -
 68
68 -
 69
69 -
70
-
71
-
72
-
73
-
74
-
75
-
76
-
77
-
78
-
79
-
80
-
81
-
82
-
83
-
84
-
85
-
86
-
87
-
88
-
89
-
90
-
91
-
92
-
93
-
94
-
95
-
96
-
97
-
98
-
99
-
100
-
101
-
102
-
103
-
104
-
105
-
106
-
107
-
108
-
109
-
110
-
111
-
112
-
113
-
114
-
115
-
116
-
117
-
118
-
119
-
120
-
121
-
122
-
123
-
124
-
125
-
126
-
127
-
128
-
129
-
130
-
131
-
132
-
133
-
134
-
135
-
136
-
137
-
138
-
139
-
140
-
141
-
142
-
143
-
144
-
145
-
146
-
147
-
148
-
149
-
150
-
151
-
152
-
153
-
154
-
155
-
156
-
157
-
158
-
159
-
160
-
161
-
162
-
163
-
164
-
165
-
166
-
167
-
168
-
169
-
170
-
171
-
172
-
173
-
174
-
175
-
176
-
177
-
178
-
179
-
180
-
181
-
182
-
183
-
184
-
185
-
186
-
187
-
188
-
189
-
190
-
191
-
192
-
193
-
194
-
195
-
196
-
197
-
198
-
199
-
200
-
201
-
202
-
203
-
204
-
205
-
206
-
207
-
208
-
209
-
210
-
211
-
212
-
213
-
214
-
215
-
216
 |
 |

57
Board review
NOKIA IN 2015
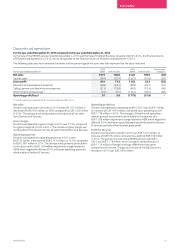
For the year ended December 31, 2014 compared to the year ended December 31, 2013
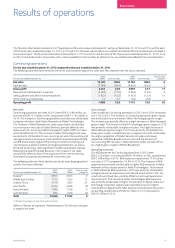
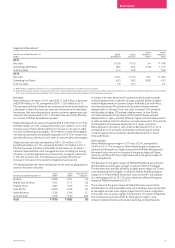
The following table sets forth selective line items and the percentage of net sales that they represent for the years indicated.
For the year ended December 31
2014
EURm % of net sales
2013
EURm % of net sales
Year-on-year
change %
Net sales 578 100.0 529 100.0 9
Cost of sales (8) (1.4) (14) (2.6) (43)
Gross prot 570 98.6 515 97.4 11
Research and development expenses (161) (27.9) (147) (27.8) 10
Selling, general and administrative expenses (65) (11.2) (56) (10.6) 16
Other income and expenses (1) (0.2) (2) (0.4) (50)
Operating prot 343 59.3 310 58.6 11
Net sales
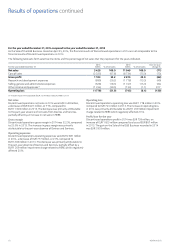
Nokia Technologies net sales in 2014 were EUR 578 million, an
increase of EUR 49 million, or 9%, compared to EUR 529 million in
2013. The increase in Nokia Technologies net sales was primarily
attributable to higher intellectual property licensing income from
certain licensees, including Microsoft becoming a more signicant
intellectual property licensee in connection with the Sale of the D&S
Business. The increase was partially oset by decreases in licensing
income from certain other licensees that experienced lower levels of
business activity, as well as lower levels of non-recurring IPR income
compared to 2013.
Gross margin
Nokia Technologies gross margin in 2014 was 98.6%, compared to
97.4% in 2013. The increase in Nokia Technologies gross margin was
primarily attributable to the absence of a one-time cost related to a
patent divestment transaction which negatively aected gross margin
in 2013.
Operating expenses
Nokia Technologies R&D expenses in 2014 were EUR 161 million, an
increase of EUR 14 million, or 10%, compared to EUR 147 million in
2013. The increase in R&D expenses was primarily attributable to
investments in business activities, such as building the technology
andbrand licensing units, which target new and signicant long-term
growth opportunities.
Nokia Technologies selling, general and administrative expenses
in2014 were EUR 65 million, an increase of EUR 9 million, or 16%,
compared to EUR 56 million in 2013. The increase in selling, general
and administrative expenses was primarily attributable to increased
activities, such as building the technology and brand licensing units
related to anticipated and ongoing patent licensing cases, as well as
higher business support costs.
Nokia Technologies other income and expense in 2014 was a net
expense of EUR 1 million, a decrease of EUR 1 million, compared to
anet expense of EUR 2 million in 2013.
Operating prot
Nokia Technologies operating prot in 2014 was EUR 343 million, an
increase of EUR 33 million, or 11%, compared to an operating prot of
EUR 310 million in 2013. The increase in operating prot was primarily
attributable to an increase in gross prot. The increase was partially
oset by higher operating expenses. Nokia Technologies operating
margin in 2014 was 59.3% compared to 58.6% in 2013.
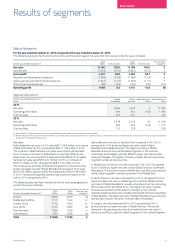
Group Common Functions
For the year ended December 31, 2015 compared to the year ended
December 31, 2014
Group Common Functions operating loss in 2015 was EUR 127 million,
a decrease of EUR 15 million, or 11%, compared to an operating loss
of EUR 142 million in 2014. The decrease in Group Common Functions
operating loss was primarily attributable to change in other income
and expense, partially oset by an increase in selling, general and
administrative expenses. Other income and expense in 2015 included
net income of approximately EUR 100 million related to investments
made through unlisted venture funds, a signicant portion of which
resulted from Nokia Growth Partners selling its holdings in Ganji.com
to 58.com for a combination of cash and shares. The increase in
selling, general and administrative expenses was primarily attributable
to transaction and other related costs. In 2015, Group Common
Functions included transaction-related costs of EUR 99 million
compared to EUR 25 million in 2014.
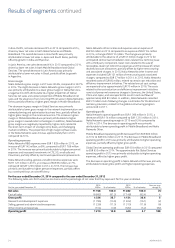
For the year ended December 31, 2014 compared to the year ended
December 31, 2013
Group Common Functions operating loss in 2014 was EUR 142 million,
an increase of EUR 85 million, or 149%, compared to an operating loss
of EUR 57 million in 2013. The increase in operating loss was primarily
attributable to the absence of a distribution from an unlisted venture
fund-related to the disposal of the fund’s investment in Waze Ltd of
EUR 59 million that beneted Group Common Functions in 2013. In
2014, Group Common Functions included transaction-related costs
ofEUR 25 million. In 2013, Group Common Functions included
restructuring charges and associated impairments of EUR 10 million,
as well as transaction-related costs ofEUR 18 million related to the
Sale of the D&S Business.