Nokia 2015 Annual Report Download - page 155
Download and view the complete annual report
Please find page 155 of the 2015 Nokia annual report below. You can navigate through the pages in the report by either clicking on the pages listed below, or by using the keyword search tool below to find specific information within the annual report.-
 1
1 -
2
-
3
-
4
-
5
-
6
-
7
-
8
-
9
-
10
-
11
-
12
-
13
-
14
-
15
-
16
-
17
-
18
-
19
-
20
-
21
-
22
-
23
-
24
-
25
-
26
-
27
-
28
-
29
-
30
-
31
-
32
-
33
-
34
-
35
-
36
-
37
-
38
-
39
-
40
-
41
-
42
-
43
-
44
-
45
-
46
-
47
-
48
-
49
-
50
-
51
-
52
-
53
-
54
-
55
-
56
-
57
-
58
-
59
-
60
-
61
-
62
-
63
-
64
-
65
-
66
-
67
-
68
-
69
-
70
-
71
-
72
-
73
-
74
-
75
-
76
-
77
-
78
-
79
-
80
-
81
-
82
-
83
-
84
-
85
-
86
-
87
-
88
-
89
-
90
-
91
-
92
-
93
-
94
-
95
-
96
-
97
-
98
-
99
-
100
-
101
-
102
-
103
-
104
-
105
-
106
-
107
-
108
-
109
-
110
-
111
-
112
-
113
-
114
-
115
-
116
-
117
-
118
-
119
-
120
-
121
-
122
-
123
-
124
-
125
-
126
-
127
-
128
-
129
-
130
-
131
-
132
-
133
-
134
-
135
-
136
-
137
-
138
-
139
-
140
-
141
-
142
-
143
-
144
-
 145
145 -
 146
146 -
 147
147 -
 148
148 -
 149
149 -
 150
150 -
 151
151 -
 152
152 -
 153
153 -
 154
154 -
 155
155 -
 156
156 -
 157
157 -
 158
158 -
 159
159 -
 160
160 -
 161
161 -
 162
162 -
 163
163 -
 164
164 -
 165
165 -
166
-
167
-
168
-
169
-
170
-
171
-
172
-
173
-
174
-
175
-
176
-
177
-
178
-
179
-
180
-
181
-
182
-
183
-
184
-
185
-
186
-
187
-
188
-
189
-
190
-
191
-
192
-
193
-
194
-
195
-
196
-
197
-
198
-
199
-
200
-
201
-
202
-
203
-
204
-
205
-
206
-
207
-
208
-
209
-
210
-
211
-
212
-
213
-
214
-
215
-
216
 |
 |

153
Financial statements
NOKIA IN 2015
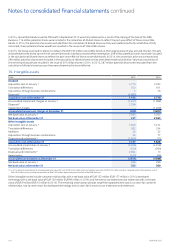
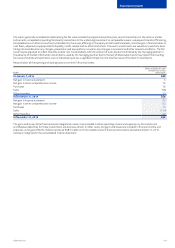
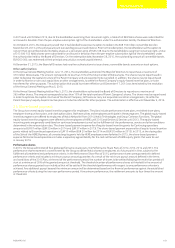
15. Earnings per share
2015
EURm
2014
EURm
2013
EURm
Basic
Prot/(loss) attributable to equity holders of the parent
Continuing operations 1 192 2 710 273
Discontinued operations 1 274 752 (888)
Total 2 466 3 462 (615)
Diluted
Elimination of interest expense, net of tax, on convertible bonds,
where dilutive 36 60 –
Prot/(loss) attributable to equity holders of the parent adjusted for
the eect of dilution
Continuing operations 1 228 2 770 273
Discontinued operations 1 274 752 (888)
Total 2 502 3 522 (615)
000s shares 000s shares 000s shares
Basic
Weighted average number of shares in issue 3 670 934 3 698 723 3 712 079
Eect of dilutive securities
Restricted shares and other 4 253 14 419 19 307
Performance shares 3 179 1 327 –
Stock options 1 971 3 351 1 978
9 403 19 097 21 285
Assumed conversion of convertible bonds 268 975 413 782 –
278 378 432 879 21 285
Diluted
Adjusted weighted average number of shares and assumed conversions
Continuing operations 3 949 312 4 131 602 3 733 364
Discontinued operations 3 949 312 4 131 602 3 712 079
Total 3 949 312 4 131 602 3 712 079
Earnings per share to equity holders of the parent EUR EUR EUR
Basic earnings per share
Continuing operations 0.32 0.73 0.07
Discontinued operations 0.35 0.20 (0.24)
Prot/(loss) for the year 0.67 0.94 (0.17)
Diluted earnings per share
Continuing operations 0.31 0.67 0.07
Discontinued operations 0.32 0.18 (0.24)
Prot/(loss) for the year 0.63 0.85 (0.17)
Basic earnings per share is calculated by dividing the prot/loss attributable to equity holders of the parent by the weighted average number
ofshares outstanding during the year, excluding shares purchased by the Group and held as treasury shares. Diluted earnings per share is
calculated by adjusting the prot/loss attributable to equity holders of the parent to eliminate the interest expense of dilutive convertible
bonds and by adjusting the weighted average number of shares outstanding with the dilutive eect of stock options, restricted shares and
performance shares outstanding during the period as well as the assumed conversion of convertible bonds.
There are no restricted shares outstanding in 2015 and 2014 (19 million in 2013) that could potentially have a dilutive impact in the future
butare excluded from the calculation as they are determined to be anti-dilutive.
4million performance shares (fewer than 1 million in 2014 and 4 million in 2013) have been excluded from the calculation of diluted shares
ascontingency conditions have not been met.
Stock options equivalent to fewer than 1million shares (2 million in 2014 and 16million in 2013) have been excluded from the calculation
ofdiluted shares as they are determined to be anti-dilutive.