Nokia 2015 Annual Report Download - page 201
Download and view the complete annual report
Please find page 201 of the 2015 Nokia annual report below. You can navigate through the pages in the report by either clicking on the pages listed below, or by using the keyword search tool below to find specific information within the annual report.-
 1
1 -
2
-
3
-
4
-
5
-
6
-
7
-
8
-
9
-
10
-
11
-
12
-
13
-
14
-
15
-
16
-
17
-
18
-
19
-
20
-
21
-
22
-
23
-
24
-
25
-
26
-
27
-
28
-
29
-
30
-
31
-
32
-
33
-
34
-
35
-
36
-
37
-
38
-
39
-
40
-
41
-
42
-
43
-
44
-
45
-
46
-
47
-
48
-
49
-
50
-
51
-
52
-
53
-
54
-
55
-
56
-
57
-
58
-
59
-
60
-
61
-
62
-
63
-
64
-
65
-
66
-
67
-
68
-
69
-
70
-
71
-
72
-
73
-
74
-
75
-
76
-
77
-
78
-
79
-
80
-
81
-
82
-
83
-
84
-
85
-
86
-
87
-
88
-
89
-
90
-
91
-
92
-
93
-
94
-
95
-
96
-
97
-
98
-
99
-
100
-
101
-
102
-
103
-
104
-
105
-
106
-
107
-
108
-
109
-
110
-
111
-
112
-
113
-
114
-
115
-
116
-
117
-
118
-
119
-
120
-
121
-
122
-
123
-
124
-
125
-
126
-
127
-
128
-
129
-
130
-
131
-
132
-
133
-
134
-
135
-
136
-
137
-
138
-
139
-
140
-
141
-
142
-
143
-
144
-
145
-
146
-
147
-
148
-
149
-
150
-
151
-
152
-
153
-
154
-
155
-
156
-
157
-
158
-
159
-
160
-
161
-
162
-
163
-
164
-
165
-
166
-
167
-
168
-
169
-
170
-
171
-
172
-
173
-
174
-
175
-
176
-
177
-
178
-
179
-
180
-
181
-
182
-
183
-
184
-
185
-
186
-
187
-
188
-
189
-
190
-
 191
191 -
 192
192 -
 193
193 -
 194
194 -
 195
195 -
 196
196 -
 197
197 -
 198
198 -
 199
199 -
 200
200 -
 201
201 -
 202
202 -
 203
203 -
 204
204 -
 205
205 -
 206
206 -
 207
207 -
 208
208 -
 209
209 -
 210
210 -
 211
211 -
212
-
213
-
214
-
215
-
216
 |
 |

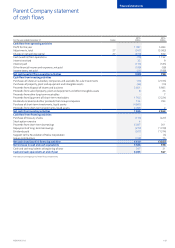
199
Financial statements
NOKIA IN 2015
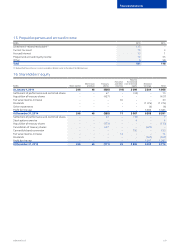
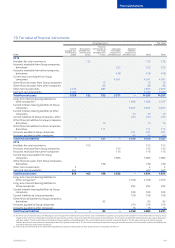
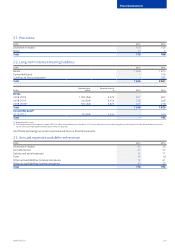
19. Fair value of nancial instruments
EURm
Carrying amounts Fair value(1)
Current
available-for-
sale financial
assets
Non-current
available-for-
sale financial
assets
Financial
instruments at
fair value
through profit
or loss
Loans and
receivables
measured at
amortized cost
Financial
liabilities
measured at
amortized cost Total Total
2015
Available-for-sale investments 132 132 132
Accounts receivable from Group companies,
derivatives 252 252 252
Accounts receivable from other companies,
derivatives 478 478 478
Current loans receivable from Group
companies 4 541 4 541 4 541
Other nancial assets from Group companies 12 12 12
Other nancial assets from other companies 96 96 96
Short-term investments 2 126 687 2 813 2 813
Cash and cash equivalents 6 033 6 033 6 033
Total nancial assets 8 159 132 795 5 271 –14 357 14 357
Long-term interest-bearing liabilities to
other companies(2) 1 946 1 946 2 017
Current interest-bearing liabilities to Group
companies 6 937 6 937 6 937
Current interest-bearing liabilities to other
companies 30 30 30
Current liabilities to Group companies, other 270 270 270
Other nancial liabilities to Group companies,
derivatives 16 16 16
Other nancial liabilities to other companies,
derivatives 111 111 111
Accounts payable to Group companies 201 201 201
Accounts payable to other companies 45 45 45
Total nancial liabilities – – 127 –9 429 9 556 9 627
2014
Available-for-sale investments 105 105 105
Accounts receivable from Group companies 150 150 150
Accounts receivable from other companies 116 116 116
Current loans receivable from Group
companies 3 986 3 986 3 986
Other nancial assets from Group companies,
derivatives 168 168 168
Short-term investments 2 2 2
Cash and cash equivalents 347 347 347
Total nancial assets 349 105 168 4 252 – 4 874 4 874
Long-term interest-bearing liabilities to
other companies(2) 2 558 2 558 3 976
Long-term interest-bearing liabilities to
Group companies 283 283 283
Current interest-bearing liabilities to Group
companies 939 939 939
Current liabilities to Group companies 728 728 728
Other nancial liabilities to Group companies,
derivatives 63 63 63
Accounts payable to Group companies 216 216 216
Accounts payable to other companies 16 16 16
Total nancial liabilities – – 63 – 4 740 4 803 6 221
(1) For items not carried at fair value, the following fair value measurement methods are used. The fair value is estimated to equal the carrying amount for available-for-sale investments carried at cost less
impairment for which it is not possible to estimate fair value reliably as there is no active market for these private fund investments. These assets are tested for impairment annually using a discounted
cash ow analysis. The fair value of loans receivable and loans payable is estimated based on the current market values of similar instruments (level 2). The fair values of long-term interest bearing
liabilities are based on discounted cash ow analysis (level 2) or quoted prices (level 1). The fair value is estimated to equal the carrying amount for short-term nancial assets and nancial liabilities due
to limited credit risk and short time to maturity.
(2) The fair values of other long-term interest-bearing liabilities are based on discounted cash ow analysis (level 2) or quoted prices (level 1).