Nokia 2015 Annual Report Download - page 138
Download and view the complete annual report
Please find page 138 of the 2015 Nokia annual report below. You can navigate through the pages in the report by either clicking on the pages listed below, or by using the keyword search tool below to find specific information within the annual report.-
 1
1 -
2
-
3
-
4
-
5
-
6
-
7
-
8
-
9
-
10
-
11
-
12
-
13
-
14
-
15
-
16
-
17
-
18
-
19
-
20
-
21
-
22
-
23
-
24
-
25
-
26
-
27
-
28
-
29
-
30
-
31
-
32
-
33
-
34
-
35
-
36
-
37
-
38
-
39
-
40
-
41
-
42
-
43
-
44
-
45
-
46
-
47
-
48
-
49
-
50
-
51
-
52
-
53
-
54
-
55
-
56
-
57
-
58
-
59
-
60
-
61
-
62
-
63
-
64
-
65
-
66
-
67
-
68
-
69
-
70
-
71
-
72
-
73
-
74
-
75
-
76
-
77
-
78
-
79
-
80
-
81
-
82
-
83
-
84
-
85
-
86
-
87
-
88
-
89
-
90
-
91
-
92
-
93
-
94
-
95
-
96
-
97
-
98
-
99
-
100
-
101
-
102
-
103
-
104
-
105
-
106
-
107
-
108
-
109
-
110
-
111
-
112
-
113
-
114
-
115
-
116
-
117
-
118
-
119
-
120
-
121
-
122
-
123
-
124
-
125
-
126
-
127
-
 128
128 -
 129
129 -
 130
130 -
 131
131 -
 132
132 -
 133
133 -
 134
134 -
 135
135 -
 136
136 -
 137
137 -
 138
138 -
 139
139 -
 140
140 -
 141
141 -
 142
142 -
 143
143 -
 144
144 -
 145
145 -
 146
146 -
 147
147 -
 148
148 -
149
-
150
-
151
-
152
-
153
-
154
-
155
-
156
-
157
-
158
-
159
-
160
-
161
-
162
-
163
-
164
-
165
-
166
-
167
-
168
-
169
-
170
-
171
-
172
-
173
-
174
-
175
-
176
-
177
-
178
-
179
-
180
-
181
-
182
-
183
-
184
-
185
-
186
-
187
-
188
-
189
-
190
-
191
-
192
-
193
-
194
-
195
-
196
-
197
-
198
-
199
-
200
-
201
-
202
-
203
-
204
-
205
-
206
-
207
-
208
-
209
-
210
-
211
-
212
-
213
-
214
-
215
-
216
 |
 |

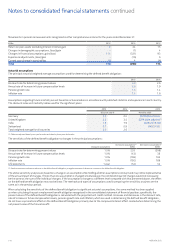
136 NOKIA IN 2015
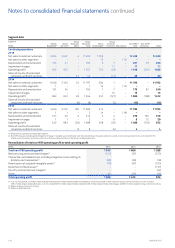
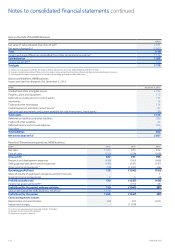
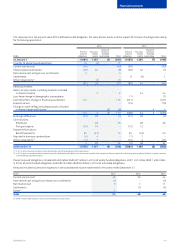
Segment data
Segment
EURm
Mobile
Broadband(1)
Global
Services(1)
Nokia
Networks
Other
Nokia
Networks
Total
Nokia
Technologies(1)
Group
Common
Functions Eliminations
Non-IFRS(2)
total
Non-IFRS(2)
exclusions Total
Continuing operations
2015
Net sales to external customers 6 064 5 422 411 490 1 009 – – 12 499 –12 499
Net sales to other segments – – – – 15 – (15) –––
Depreciation and amortization 153 41 – 194 6 7 – 207 79 286
Impairment charges – – – – – 11 – 11 –11
Operating prot 604 653 – 1 257 720 (28) – 1 949 (261) 1 688
Share of results of associated
companies andjointventures – – 43 43 – (14) – 29 –29
2014
Net sales to external customers 6 038 5 105 54 11 197 564 1– 11 762 –11 762
Net sales to other segments 1– – 114 –(15) –––
Depreciation and amortization 131 34 –165 1 7 – 173 67 240
Impairment charges – – – – – 15 – 15 –15
Operating prot 683 653 28 1 364 357 (121) – 1 600 (188) 1 412
Share of results of associated
companies andjointventures – – (9) (9) –(3) – (12) –(12)
2013
Net sales to external customers 5 346 5 752 182 11 280 515 – – 11 795 –11 795
Net sales to other segments 1 1 – 2 14 –(16) –––
Depreciation and amortization 157 50 6213 3 3 – 219 100 319
Impairment charges 1 1 – 2 – 6– 8 12 20
Operating prot 422 693 (26) 1 089 329 (30) – 1 388 (716) 672
Share of results of associated
companies andjointventures – – 8 8 – (4) – 4 –4
(1) Represents an operating and reportable segment.
(2) Non-IFRS measures exclude goodwill impairment charges, intangible asset amortization and items related to purchase price allocation, as well as restructuring-related costs, costs related to the
AlcatelLucent transaction and certain other items that may not be indicative of the Group’s underlying business.
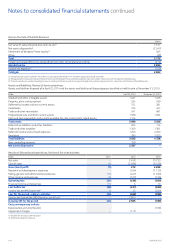
Reconciliation of total non-IFRS operating prot to total operating prot
EURm 2015 2014 2013
Total non-IFRS operating prot 1 949 1 600 1 388
Restructuring and associated charges(1) (123) (57) (373)
Transaction and related costs, including integration costs relating to
Alcatel Lucent acquisition(2) (99) (39) (18)
Amortization of acquired intangible assets(3) (79) (67) (100)
Divestment of businesses(3) –
–
(157)
Country and contract exit charges(3) –
–
(52)
Other 40 (25) (16)
Total operating prot 1 688 1 412 672
(1) In 2015, includes EUR 121 million related to Nokia Networks, EUR 3 million related to Nokia Technologies and a reversal of EUR 1 million related to Group Common Functions. In 2014, included
EUR57million related to Nokia Networks. In 2013, included EUR 361 million related to Nokia Networks, EUR 2 million related to Nokia Technologies and EUR 10 million related to Group Common Functions.
(2) Relates to Group Common Functions.
(3) Relates to Nokia Networks.
Notes to consolidated nancial statements continued