Nokia 2015 Annual Report Download - page 58
Download and view the complete annual report
Please find page 58 of the 2015 Nokia annual report below. You can navigate through the pages in the report by either clicking on the pages listed below, or by using the keyword search tool below to find specific information within the annual report.-
 1
1 -
2
-
3
-
4
-
5
-
6
-
7
-
8
-
9
-
10
-
11
-
12
-
13
-
14
-
15
-
16
-
17
-
18
-
19
-
20
-
21
-
22
-
23
-
24
-
25
-
26
-
27
-
28
-
29
-
30
-
31
-
32
-
33
-
34
-
35
-
36
-
37
-
38
-
39
-
40
-
41
-
42
-
43
-
44
-
45
-
46
-
47
-
 48
48 -
 49
49 -
 50
50 -
 51
51 -
 52
52 -
 53
53 -
 54
54 -
 55
55 -
 56
56 -
 57
57 -
 58
58 -
 59
59 -
 60
60 -
 61
61 -
 62
62 -
 63
63 -
 64
64 -
 65
65 -
 66
66 -
 67
67 -
 68
68 -
69
-
70
-
71
-
72
-
73
-
74
-
75
-
76
-
77
-
78
-
79
-
80
-
81
-
82
-
83
-
84
-
85
-
86
-
87
-
88
-
89
-
90
-
91
-
92
-
93
-
94
-
95
-
96
-
97
-
98
-
99
-
100
-
101
-
102
-
103
-
104
-
105
-
106
-
107
-
108
-
109
-
110
-
111
-
112
-
113
-
114
-
115
-
116
-
117
-
118
-
119
-
120
-
121
-
122
-
123
-
124
-
125
-
126
-
127
-
128
-
129
-
130
-
131
-
132
-
133
-
134
-
135
-
136
-
137
-
138
-
139
-
140
-
141
-
142
-
143
-
144
-
145
-
146
-
147
-
148
-
149
-
150
-
151
-
152
-
153
-
154
-
155
-
156
-
157
-
158
-
159
-
160
-
161
-
162
-
163
-
164
-
165
-
166
-
167
-
168
-
169
-
170
-
171
-
172
-
173
-
174
-
175
-
176
-
177
-
178
-
179
-
180
-
181
-
182
-
183
-
184
-
185
-
186
-
187
-
188
-
189
-
190
-
191
-
192
-
193
-
194
-
195
-
196
-
197
-
198
-
199
-
200
-
201
-
202
-
203
-
204
-
205
-
206
-
207
-
208
-
209
-
210
-
211
-
212
-
213
-
214
-
215
-
216
 |
 |

56 NOKIA IN 2015
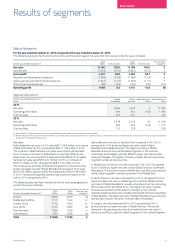
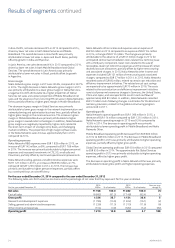
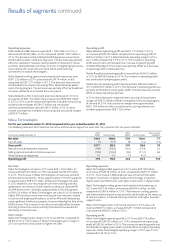
Results of segments continued
Operating expenses
Nokia Networks R&D expenses were EUR 1 786 million in 2014, a
decrease of EUR 36 million, or 2%, compared to EUR 1 822 million in
2013. The decrease in Nokia Networks R&D expenses was primarily
attributable to lower subcontracting costs. The decrease was partially
oset by headcount increases mainly related to increased in-house
activities. Nokia Networks continues to invest in targeted growth areas,
most notably LTE, small cells and Telco Cloud, while reducing
investments in mature technologies.
Nokia Networks selling, general and administrative expenses were
EUR1 236 million in 2014, a decrease of EUR 74 million, or 6%,
compared to EUR 1 310 million in 2013. The decrease was primarily
attributable to structural cost savings from Nokia Networks global
restructuring program. The decrease was partially oset by headcount
increases related to an increased focus on growth.
Nokia Networks other income and expenses decreased in 2014 to
anexpense of EUR 104 million from an expense of EUR 582 million
in2013. In 2014, other income and expenses included restructuring
and associated charges of EUR 57 million and anticipated
contractualremediation costs of EUR 31 million. In 2013, other
incomeand expenses included restructuring and associated charges
of EUR 570 million.
Operating prot
Nokia Networks operating prot was EUR 1 210 million in 2014,
anincrease of EUR 790 million compared to an operating prot of
EUR 420 million in 2013. Nokia Networks operating margin in 2014
was10.8% compared to 3.7% in 2013. The increase in operating
protwasprimarily attributable to an increase in operating prot
inMobile Broadband. The increase was partially oset by a decrease
inoperating prot in Global Services.
Mobile Broadband operating prot increased from EUR 420 million
in2013 to EUR 683 million in 2014. The increase in operating prot
was attributable to higher gross prot.
Global Services operating prot decreased from EUR 693 million in
2013 to EUR 653 million in 2014. The decrease in operating prot was
primarily attributable to lower gross prot. The decrease was partially
oset by lower operating expenses.
In 2014, Nokia Networks recognized restructuring and associated
charges of EUR 57 million related to the global restructuring program.
At the end of 2014, the cumulative charges were approximately
EUR1900 million and the cumulative restructuring-related cash
outows approximately EUR 1 550 million.
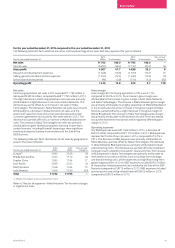
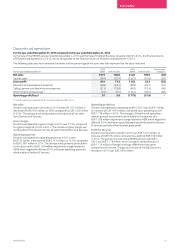
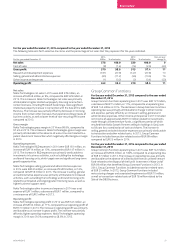
Nokia Technologies
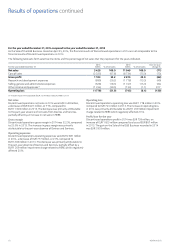
For the year ended December 31, 2015 compared to the year ended December 31, 2014
The following table sets forth selective line items and the percentage of net sales that they represent for the years indicated.
For the year ended December 31
2015
EURm % of net sales
2014
EURm % of net sales
Year-on-year
change %
Net sales 1 024 100.0 578 100.0 77
Cost of sales (7) (0.7) (8) (1.4) (13)
Gross prot 1 017 99.3 570 98.6 78
Research and development expenses (199) (19.4) (161) (27.9) 24
Selling, general and administrative expenses (109) (10.6) (65) (11.2) 68
Other income and expenses 10 1.0 (1) (0.2) –
Operating prot 719 70.2 343 59.3 110
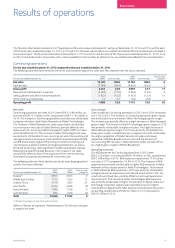
Net sales
Nokia Technologies net sales in 2015 were EUR 1 024 million, an
increase of EUR 446 million, or 77%, compared to EUR 578 million
in2014. The increase in Nokia Technologies net sales was primarily
attributable to two factors. Firstly, approximately 70% of the growth,
or approximately EUR 310 million, of Nokia Technologies net sales
in2015 related to non-recurring net sales from existing and new
agreements, and revenue share related to previously divested IPR
andIPRdivestments. Secondly, approximately 30% of the growth,
orEUR130 million, of Nokia Technologies net sales in 2015 related to
higher IPR licensing income from existing and new licensees, related
tosettled and ongoing arbitrations, as well as Microsoft becoming a
more signicant intellectual property licensee following the Sale of the
D&S Business. The increase in net sales was partially oset by lower
licensing income from certain existing licensees that experienced
decreases in handset sales.
Gross margin
Nokia Technologies gross margin in 2015 was 99.3%, compared to
98.6% in 2014. The increase in Nokia Technologies gross margin in
2015 was primarily attributable to higher net sales.
Operating expenses
Nokia Technologies R&D expenses in 2015 were EUR 199 million,
anincrease of EUR 38 million, or 24%, compared to EUR 161 million
in2014. The increase in R&D expenses was primarily attributable
tohigher investments in digital media and technology incubation,
higherpatent portfolio costs, and higher investments in digital health.
Nokia Technologies selling, general and administrative expenses in
2015 were EUR 109 million, an increase of EUR 44 million, or 68%,
compared to EUR 65 million in 2014. The increase in selling, general
and administrative expenses was primarily attributable to the ramp-up
of new businesses, increased licensing activities, and higher business
support costs.
Nokia Technologies other income and expense in 2015 was a net
income of EUR 10 million, a change of EUR 11 million compared to
anet expense of EUR 1 million in 2014.
Operating prot
Nokia Technologies operating prot in 2015 was EUR 719 million,
anincrease of EUR 376 million, or 110%, compared to an operating
prot of EUR 343 million in 2014. The increase in operating prot was
attributable to higher gross prot, partially oset by higher operating
expenses. Nokia Technologies operating margin in 2015 was 70.2%
compared to 59.3% in 2014.