Nokia 2015 Annual Report Download - page 52
Download and view the complete annual report
Please find page 52 of the 2015 Nokia annual report below. You can navigate through the pages in the report by either clicking on the pages listed below, or by using the keyword search tool below to find specific information within the annual report.-
 1
1 -
2
-
3
-
4
-
5
-
6
-
7
-
8
-
9
-
10
-
11
-
12
-
13
-
14
-
15
-
16
-
17
-
18
-
19
-
20
-
21
-
22
-
23
-
24
-
25
-
26
-
27
-
28
-
29
-
30
-
31
-
32
-
33
-
34
-
35
-
36
-
37
-
38
-
39
-
40
-
41
-
 42
42 -
 43
43 -
 44
44 -
 45
45 -
 46
46 -
 47
47 -
 48
48 -
 49
49 -
 50
50 -
 51
51 -
 52
52 -
 53
53 -
 54
54 -
 55
55 -
 56
56 -
 57
57 -
 58
58 -
 59
59 -
 60
60 -
 61
61 -
 62
62 -
63
-
64
-
65
-
66
-
67
-
68
-
69
-
70
-
71
-
72
-
73
-
74
-
75
-
76
-
77
-
78
-
79
-
80
-
81
-
82
-
83
-
84
-
85
-
86
-
87
-
88
-
89
-
90
-
91
-
92
-
93
-
94
-
95
-
96
-
97
-
98
-
99
-
100
-
101
-
102
-
103
-
104
-
105
-
106
-
107
-
108
-
109
-
110
-
111
-
112
-
113
-
114
-
115
-
116
-
117
-
118
-
119
-
120
-
121
-
122
-
123
-
124
-
125
-
126
-
127
-
128
-
129
-
130
-
131
-
132
-
133
-
134
-
135
-
136
-
137
-
138
-
139
-
140
-
141
-
142
-
143
-
144
-
145
-
146
-
147
-
148
-
149
-
150
-
151
-
152
-
153
-
154
-
155
-
156
-
157
-
158
-
159
-
160
-
161
-
162
-
163
-
164
-
165
-
166
-
167
-
168
-
169
-
170
-
171
-
172
-
173
-
174
-
175
-
176
-
177
-
178
-
179
-
180
-
181
-
182
-
183
-
184
-
185
-
186
-
187
-
188
-
189
-
190
-
191
-
192
-
193
-
194
-
195
-
196
-
197
-
198
-
199
-
200
-
201
-
202
-
203
-
204
-
205
-
206
-
207
-
208
-
209
-
210
-
211
-
212
-
213
-
214
-
215
-
216
 |
 |
50 NOKIA IN 2015
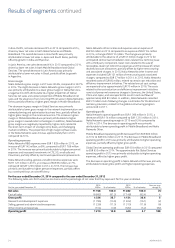
Results of operations continued
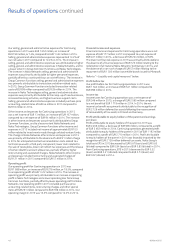
In 2014, our selling, general and administrative expenses were
EUR1453 million, a decrease of EUR 30 million or 2%, compared
toEUR 1483 million in 2013. Selling, general and administrative
expenses represented 12.4% of our net sales in 2014 compared to
12.6% in 2013. The decrease in selling, general and administrative
expenses was primarily attributable to the decrease in selling, general
and administrative expenses in Nokia Networks. The decrease was
partially oset by an increase in selling, general and administrative
expenses in Group Common Functions and Nokia Technologies.
Thedecrease in selling, general and administrative expenses in Nokia
Networks was primarily attributable to structural cost savings from
Nokia Networks global restructuring program. The decrease was
partially oset by headcount increases related to an increased
focuson growth. The increase in selling, general and administrative
expenses in Group Common Functions was primarily attributable to
transaction-related costs resulting from the Sale of the D&S Business.
The increase inselling, general and administrative expenses in
NokiaTechnologies was primarily attributable to increased activities,
such as building the technology and brand licensing units, related
toanticipated and ongoing patent licensing cases, as well as higher
business support costs. In 2014, selling, general and administrative
expenses included EUR 30 million of transaction-related costs.
Selling,general and administrative expenses included purchase price
accounting-related items of EUR 35 million in 2014 compared to
EUR80 million in 2013.
Other income and expenses was a net expense of EUR 94 million in
2014, compared to a net expense of EUR 513 million in 2013. The
change in other income and expenses was primarily attributable to
Nokia Networks, partially oset by Group Common Functions. In 2014,
Nokia Networks other income and expenses included restructuring
andassociated charges of EUR 57 million and anticipated contractual
remediation costs of EUR 31 million. In 2013, Nokia Networks other
income and expenses included restructuring andassociated charges
of EUR 570 million.
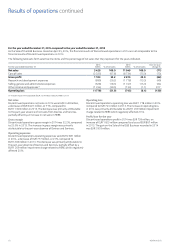
Operating prot
Our operating prot in 2014 was EUR 1 412 million, an increase
ofEUR740 million, or 110%, compared to an operating prot of
EUR 672 million in 2013. The increase in operating prot was
attributable to both Nokia Networks and Nokia Technologies. Our
operating prot in 2014 included purchase price accounting-related
items, restructuring charges and other special items of EUR 188 million
compared to EUR 716 million in 2013. Our operating margin in 2014
was 12.0% compared to5.7% in 2013.
Financial income and expenses
Financial income and expenses in 2014 was a net expense of
EUR 401 million, compared to a net expense of EUR 277 million
in2013. The higher net nancial expense in 2014 was primarily
attributable to aEUR 123 million one–time charge related to the
redemption of materially all of Nokia Networks’ borrowings, and
anon-cash charge ofEUR 57 million related to the repayment
ofEUR1500 million convertible bond issued to Microsoft.
Thesecharges were partially oset by reduced interest expenses
andlowernet foreign exchange losses.
Refer to “—Liquidity and capital resources” below.
Prot before tax
Continuing operations’ prot before tax was EUR 999 million in 2014,
compared to EUR 399 million in 2013.
Income tax
Income taxes for Continuing operations was a net benet of
EUR 1 719 million in 2014, a change of EUR 1 990 million compared
toa net expense of EUR 271 million in 2013. The net income tax
benet was primarily attributable to the recognition of EUR 2 126
million deferred tax assets from the reassessment of recoverability
oftax assets in Finland and Germany in 2014, which resulted in a
EUR 2 034 million non-cash tax benet in the third quarter 2014.
Following the global restructuring actions taken primarily in 2012
and2013 to reduce annualized operating expenses and production
overheads; andthe recent protability of Nokia Networks, the
divestment of thepreviously loss-making Devices & Services business;
and forecasts of future protability for Continuing operations, we were
able to re-establish a pattern of sucient protability in Finland and
Germanyto utilize the cumulative losses, foreign tax credits and
othertemporary dierences. A signicant portion of our Finnish
andGerman deferred tax assets are indenite in nature and available
against future Finnish and German tax liabilities.
Non-controlling interests
Prot for Continuing operations attributable to non-controlling
interests was EUR 8 million in 2014, compared to a loss attributable to
non-controlling interests of EUR 145 million in 2013. The change was
primarily attributable to our acquisition of Siemens’ stake in Nokia
Networks (formerly Nokia Siemens Networks) in August 2013, which
signicantly reduced non-controlling interests in that business.
Prot/loss attributable to equity holders of the parent and
earningsper share
Prot attributable to equity holders of the parent in 2014 equaled
EUR3 462 million, compared to a loss of EUR 615 million in 2013.
Continuing operations generated a prot attributable to equity
holders of the parent in 2014, equaling EUR 2 710 million, compared
to EUR 273 million in 2013. Prot attributable to equity holders of
theparent in 2014 was favorably impacted by the recognition of
EUR 2 126 million deferred tax assets. Nokia Group’s total EPS in 2014
increased to EUR 0.94 (basic) and EUR 0.85 (diluted), compared to EUR
(0.17) (basic) and EUR (0.17) (diluted) in 2013. FromContinuing
operations, EPS in 2014 increased to EUR 0.73 (basic) and EUR 0.67
(diluted), compared to EUR 0.07 (basic) and EUR 0.07 (diluted) in 2013.