Nokia 2015 Annual Report Download - page 54
Download and view the complete annual report
Please find page 54 of the 2015 Nokia annual report below. You can navigate through the pages in the report by either clicking on the pages listed below, or by using the keyword search tool below to find specific information within the annual report.-
 1
1 -
 2
2 -
 3
3 -
 4
4 -
 5
5 -
 6
6 -
 7
7 -
 8
8 -
 9
9 -
 10
10 -
 11
11 -
 12
12 -
 13
13 -
 14
14 -
 15
15 -
 16
16 -
 17
17 -
 18
18 -
 19
19 -
 20
20 -
 21
21 -
 22
22 -
 23
23 -
 24
24 -
 25
25 -
 26
26 -
 27
27 -
 28
28 -
 29
29 -
 30
30 -
 31
31 -
 32
32 -
 33
33 -
 34
34 -
 35
35 -
 36
36 -
 37
37 -
 38
38 -
 39
39 -
 40
40 -
 41
41 -
 42
42 -
 43
43 -
 44
44 -
 45
45 -
 46
46 -
 47
47 -
 48
48 -
 49
49 -
 50
50 -
 51
51 -
 52
52 -
 53
53 -
 54
54 -
 55
55 -
 56
56 -
 57
57 -
 58
58 -
 59
59 -
 60
60 -
 61
61 -
 62
62 -
 63
63 -
 64
64 -
 65
65 -
 66
66 -
 67
67 -
 68
68 -
 69
69 -
 70
70 -
 71
71 -
 72
72 -
 73
73 -
 74
74 -
 75
75 -
 76
76 -
 77
77 -
 78
78 -
 79
79 -
 80
80 -
 81
81 -
 82
82 -
 83
83 -
 84
84 -
 85
85 -
 86
86 -
 87
87 -
 88
88 -
 89
89 -
 90
90 -
 91
91 -
 92
92 -
 93
93 -
 94
94 -
 95
95 -
 96
96 -
 97
97 -
 98
98 -
 99
99 -
 100
100 -
 101
101 -
 102
102 -
 103
103 -
 104
104 -
 105
105 -
 106
106 -
 107
107 -
 108
108 -
 109
109 -
 110
110 -
 111
111 -
 112
112 -
 113
113 -
 114
114 -
 115
115 -
 116
116 -
 117
117 -
 118
118 -
 119
119 -
 120
120 -
 121
121 -
 122
122 -
 123
123 -
 124
124 -
 125
125 -
 126
126 -
 127
127 -
 128
128 -
 129
129 -
 130
130 -
 131
131 -
 132
132 -
 133
133 -
 134
134 -
 135
135 -
 136
136 -
 137
137 -
 138
138 -
 139
139 -
 140
140 -
 141
141 -
 142
142 -
 143
143 -
 144
144 -
 145
145 -
 146
146 -
 147
147 -
 148
148 -
 149
149 -
 150
150 -
 151
151 -
 152
152 -
 153
153 -
 154
154 -
 155
155 -
 156
156 -
 157
157 -
 158
158 -
 159
159 -
 160
160 -
 161
161 -
 162
162 -
 163
163 -
 164
164 -
 165
165 -
 166
166 -
 167
167 -
 168
168 -
 169
169 -
 170
170 -
 171
171 -
 172
172 -
 173
173 -
 174
174 -
 175
175 -
 176
176 -
 177
177 -
 178
178 -
 179
179 -
 180
180 -
 181
181 -
 182
182 -
 183
183 -
 184
184 -
 185
185 -
 186
186 -
 187
187 -
 188
188 -
 189
189 -
 190
190 -
 191
191 -
 192
192 -
 193
193 -
 194
194 -
 195
195 -
 196
196 -
 197
197 -
 198
198 -
 199
199 -
 200
200 -
 201
201 -
 202
202 -
 203
203 -
 204
204 -
 205
205 -
 206
206 -
 207
207 -
 208
208 -
 209
209 -
 210
210 -
 211
211 -
 212
212 -
 213
213 -
 214
214 -
 215
215 -
 216
216
 |
 |

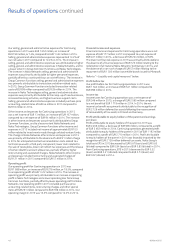
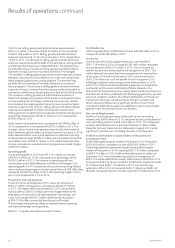
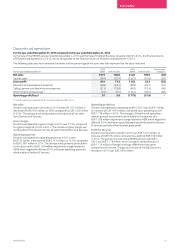
52 NOKIA IN 2015
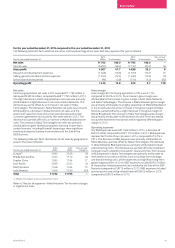
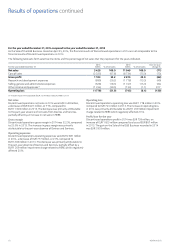
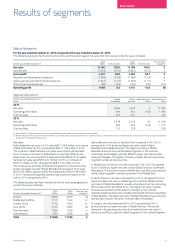
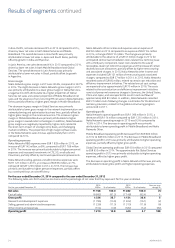
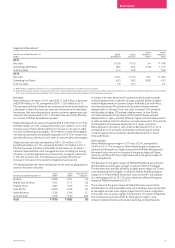
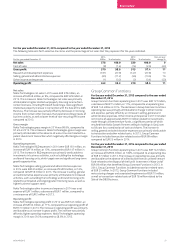
For the year ended December 31, 2014 compared to the year ended December 31, 2013
As the Sale of the D&S Business closed on April 25, 2014, the nancial results of Discontinued operations in 2014 are not comparable to the
nancial results of Discontinued operations in 2013.
The following table sets forth selective line items and the percentage of net sales that they represent for the years indicated.
For the year ended December 31
2014
EURm % of net sales
2013
EURm % of net sales
Year-on-year
change %
Net sales 3 428 100.0 11 649 100.0 (71)
Cost of sales (2 325) (67.8) (8 734) (75.0) (73)
Gross prot 1 103 32.2 2 915 25.0 (62)
Research and development expenses (899) (26.2) (1 778) (15.3) (49)
Selling, general and administrative expenses (628) (18.3) (1 747) (15.0) (64)
Other income and expenses(1) (1 354) (39.5) (133) (1.1) 917
Operating loss (1 778) (51.9) (743) (6.4) (139)
(1) Includes impairment of goodwill of EUR 1 209 million related to HERE in 2014.
Net sales
Discontinued operations net sales in 2014 were EUR 3 428 million,
adecrease of EUR 8 221 million, or 71%, compared to
EUR 11 649 million in 2013. The decrease was primarily attributable
tothe part-year absence of net sales from Devices and Services,
partially oset by an increase in net sales in HERE.
Gross margin
Discontinued operations gross margin in 2014 was 32.2%, compared
to 25.0% in 2013. The increase in gross margin was primarily
attributable to the part-year absence of Devices and Services.
Operating expenses
Discontinued operations operating expenses were EUR 2 881 million
in2014, a decrease of EUR 777 million, or 21%, compared to
EUR 3 658 million in 2013. The decrease was primarily attributable to
the part-year absence of Devices and Services, partially oset by a
EUR 1 209 million impairment charge related to HERE, which negatively
aected 2014.
Operating loss
Discontinued operations operating loss was EUR 1 778 million in 2014
compared to EUR 743 million in 2013. The increase in operating loss
in2014 was primarily attributable to a EUR 1 209 million impairment
charge related to HERE which negatively aected 2014.
Prot/loss for the year
Discontinued operations prot in 2014 was EUR 758 million, an
increase of EUR 1 625 million compared to a loss of EUR 867 million
in2013. The gain on the Sale of the D&S Business recorded in 2014
was EUR 2 803 million.
Results of operations continued
