HSBC 2010 Annual Report Download - page 99
Download and view the complete annual report
Please find page 99 of the 2010 HSBC annual report below. You can navigate through the pages in the report by either clicking on the pages listed below, or by using the keyword search tool below to find specific information within the annual report.-
 1
1 -
 2
2 -
 3
3 -
 4
4 -
 5
5 -
 6
6 -
 7
7 -
 8
8 -
 9
9 -
 10
10 -
 11
11 -
 12
12 -
 13
13 -
 14
14 -
 15
15 -
 16
16 -
 17
17 -
 18
18 -
 19
19 -
 20
20 -
 21
21 -
 22
22 -
 23
23 -
 24
24 -
 25
25 -
 26
26 -
 27
27 -
 28
28 -
 29
29 -
 30
30 -
 31
31 -
 32
32 -
 33
33 -
 34
34 -
 35
35 -
 36
36 -
 37
37 -
 38
38 -
 39
39 -
 40
40 -
 41
41 -
 42
42 -
 43
43 -
 44
44 -
 45
45 -
 46
46 -
 47
47 -
 48
48 -
 49
49 -
 50
50 -
 51
51 -
 52
52 -
 53
53 -
 54
54 -
 55
55 -
 56
56 -
 57
57 -
 58
58 -
 59
59 -
 60
60 -
 61
61 -
 62
62 -
 63
63 -
 64
64 -
 65
65 -
 66
66 -
 67
67 -
 68
68 -
 69
69 -
 70
70 -
 71
71 -
 72
72 -
 73
73 -
 74
74 -
 75
75 -
 76
76 -
 77
77 -
 78
78 -
 79
79 -
 80
80 -
 81
81 -
 82
82 -
 83
83 -
 84
84 -
 85
85 -
 86
86 -
 87
87 -
 88
88 -
 89
89 -
 90
90 -
 91
91 -
 92
92 -
 93
93 -
 94
94 -
 95
95 -
 96
96 -
 97
97 -
 98
98 -
 99
99 -
 100
100 -
 101
101 -
 102
102 -
 103
103 -
 104
104 -
 105
105 -
 106
106 -
 107
107 -
 108
108 -
 109
109 -
 110
110 -
 111
111 -
 112
112 -
 113
113 -
 114
114 -
 115
115 -
 116
116 -
 117
117 -
 118
118 -
 119
119 -
 120
120 -
 121
121 -
 122
122 -
 123
123 -
 124
124 -
 125
125 -
 126
126 -
 127
127 -
 128
128 -
 129
129 -
 130
130 -
 131
131 -
 132
132 -
 133
133 -
 134
134 -
 135
135 -
 136
136 -
 137
137 -
 138
138 -
 139
139 -
 140
140 -
 141
141 -
 142
142 -
 143
143 -
 144
144 -
 145
145 -
 146
146 -
 147
147 -
 148
148 -
 149
149 -
 150
150 -
 151
151 -
 152
152 -
 153
153 -
 154
154 -
 155
155 -
 156
156 -
 157
157 -
 158
158 -
 159
159 -
 160
160 -
 161
161 -
 162
162 -
 163
163 -
 164
164 -
 165
165 -
 166
166 -
 167
167 -
 168
168 -
 169
169 -
 170
170 -
 171
171 -
 172
172 -
 173
173 -
 174
174 -
 175
175 -
 176
176 -
 177
177 -
 178
178 -
 179
179 -
 180
180 -
 181
181 -
 182
182 -
 183
183 -
 184
184 -
 185
185 -
 186
186 -
 187
187 -
 188
188 -
 189
189 -
 190
190 -
 191
191 -
 192
192 -
 193
193 -
 194
194 -
 195
195 -
 196
196 -
 197
197 -
 198
198 -
 199
199 -
 200
200 -
 201
201 -
 202
202 -
 203
203 -
 204
204 -
 205
205 -
 206
206 -
 207
207 -
 208
208 -
 209
209 -
 210
210 -
 211
211 -
 212
212 -
 213
213 -
 214
214 -
 215
215 -
 216
216 -
 217
217 -
 218
218 -
 219
219 -
 220
220 -
 221
221 -
 222
222 -
 223
223 -
 224
224 -
 225
225 -
 226
226 -
 227
227 -
 228
228 -
 229
229 -
 230
230 -
 231
231 -
 232
232 -
 233
233 -
 234
234 -
 235
235 -
 236
236 -
 237
237 -
 238
238 -
 239
239 -
 240
240 -
 241
241 -
 242
242 -
 243
243 -
 244
244 -
 245
245 -
 246
246 -
 247
247 -
 248
248 -
 249
249 -
 250
250 -
 251
251 -
 252
252 -
 253
253 -
 254
254 -
 255
255 -
 256
256 -
 257
257 -
 258
258 -
 259
259 -
 260
260 -
 261
261 -
 262
262 -
 263
263 -
 264
264 -
 265
265 -
 266
266 -
 267
267 -
 268
268 -
 269
269 -
 270
270 -
 271
271 -
 272
272 -
 273
273 -
 274
274 -
 275
275 -
 276
276 -
 277
277 -
 278
278 -
 279
279 -
 280
280 -
 281
281 -
 282
282 -
 283
283 -
 284
284 -
 285
285 -
 286
286 -
 287
287 -
 288
288 -
 289
289 -
 290
290 -
 291
291 -
 292
292 -
 293
293 -
 294
294 -
 295
295 -
 296
296 -
 297
297 -
 298
298 -
 299
299 -
 300
300 -
 301
301 -
 302
302 -
 303
303 -
 304
304 -
 305
305 -
 306
306 -
 307
307 -
 308
308 -
 309
309 -
 310
310 -
 311
311 -
 312
312 -
 313
313 -
 314
314 -
 315
315 -
 316
316 -
 317
317 -
 318
318 -
 319
319 -
 320
320 -
 321
321 -
 322
322 -
 323
323 -
 324
324 -
 325
325 -
 326
326 -
 327
327 -
 328
328 -
 329
329 -
 330
330 -
 331
331 -
 332
332 -
 333
333 -
 334
334 -
 335
335 -
 336
336 -
 337
337 -
 338
338 -
 339
339 -
 340
340 -
 341
341 -
 342
342 -
 343
343 -
 344
344 -
 345
345 -
 346
346 -
 347
347 -
 348
348 -
 349
349 -
 350
350 -
 351
351 -
 352
352 -
 353
353 -
 354
354 -
 355
355 -
 356
356 -
 357
357 -
 358
358 -
 359
359 -
 360
360 -
 361
361 -
 362
362 -
 363
363 -
 364
364 -
 365
365 -
 366
366 -
 367
367 -
 368
368 -
 369
369 -
 370
370 -
 371
371 -
 372
372 -
 373
373 -
 374
374 -
 375
375 -
 376
376 -
 377
377 -
 378
378 -
 379
379 -
 380
380 -
 381
381 -
 382
382 -
 383
383 -
 384
384 -
 385
385 -
 386
386 -
 387
387 -
 388
388 -
 389
389 -
 390
390 -
 391
391 -
 392
392 -
 393
393 -
 394
394 -
 395
395 -
 396
396
 |
 |

97
Overview Operating & Financial Review Governance Financial Statements Shareholder Information
We do not disclose the fair value of collateral
held as security or other credit enhancements on
loans and advances past due but not impaired, or on
individually assessed impaired loans and advances,
as it is not practicable to do so.
Derivatives
The International Swaps and Derivatives Association
(‘ISDA’) Master Agreement is our preferred
agreement for documenting derivatives activity. It
provides the contractual framework within which
dealing activity across a full range of OTC products
is conducted, and contractually binds both parties to
apply close-out netting across all outstanding
transactions covered by an agreement if either party
defaults or another pre-agreed termination event
occurs. It is common, and our preferred practice, for
the parties to execute a Credit Support Annex
(‘CSA’) in conjunction with the ISDA Master
Agreement. Under a CSA, collateral is passed
between the parties to mitigate the counterparty risk
inherent in outstanding positions. The majority of
our CSAs are with financial institutional clients.
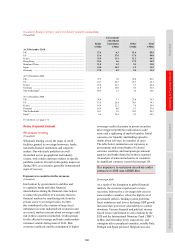
The derivative offset amount in the above table
relates to exposures where the counterparty has an
offsetting derivative exposure with HSBC, a master
netting arrangement is in place and the credit risk
exposure is managed on a net basis, or the position is
specifically collateralised, normally in the form of
cash. At 31 December 2010, the total amount of such
offsets was US$197.5bn (2009: US$189.6bn), of
which US$178.3bn (2009: US$168.5bn) were offsets
under a master netting arrangement, US$19.0bn
(2009: US$21.0bn) were collateral received in cash
and US$0.2bn (2009: US$0.1bn) were other
collateral. These amounts do not qualify for net
presentation for accounting purposes, as settlement
may not actually be made on a net basis.
Treasury, other eligible bills and debt securities
Debt securities, treasury and other eligible bills are
generally unsecured except for asset-backed
securities (‘ABS’) and similar instruments, which
are secured by pools of financial assets.
Items in the course of collection from other banks
Settlement risk arises in any situation where a
payment in cash, securities or equities is made in the
expectation of a corresponding receipt of cash,
securities or equities. Daily settlement limits are
established for counterparties to cover the aggregate
of our transactions with each one on any single day.
We substantially mitigate settlement risk on
many transactions, particularly those involving
securities and equities, by settling through assured
payment systems or on a delivery-versus-payment
basis.
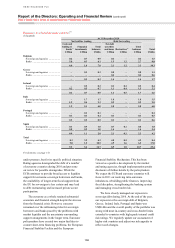
Concentration of exposure
(Audited)
Concentrations of credit risk arise when a number
of counterparties or exposures have comparable
economic characteristics, or such counterparties are
engaged in similar activities or operate in the same
geographical areas or industry sectors, so that their
collective ability to meet contractual obligations is
uniformly affected by changes in economic, political
or other conditions. We use a number of controls
and measures to minimise undue concentration of
exposure in our portfolios across industry, country
and customer groups. These include portfolio and
counterparty limits, approval and review controls,
and stress testing.
Wrong-way risk is an aggravated form of
concentration risk and arises when there is a strong
correlation between the counterparty’s probability
of default and the mark-to-market value of the
underlying transaction. We use a range of procedures
to monitor and control wrong-way risk, including
requiring entities to obtain prior approval before
undertaking wrong-way risk transactions outside
pre-agreed guidelines.
Securities held for trading
(Unaudited)
A detailed analysis of securities held for trading is
set out in Note 15 on the Financial Statements and an
analysis of credit quality is provided on page 114.
Debt securities, treasury and other eligible bills
(Unaudited)
HSBC’s holdings of corporate debt, ABS and other
securities were spread across a wide range of issuers
and geographical regions, with 25% invested in
securities issued by banks and other financial
institutions. A more detailed analysis of financial
investments is set out in Note 21 on the Financial
Statements and an analysis by credit quality is
provided on page 114.
At 31 December 2010, our insurance businesses
held diversified portfolios of debt and equity
securities designated at fair value (2010: US$28bn;
2009: US$25bn) and debt securities classified as
financial investments (2010: US$38bn; 2009:
US$35bn). A more detailed analysis of securities
held by the insurance businesses is set out on
page 162.
