HSBC 2010 Annual Report Download - page 103
Download and view the complete annual report
Please find page 103 of the 2010 HSBC annual report below. You can navigate through the pages in the report by either clicking on the pages listed below, or by using the keyword search tool below to find specific information within the annual report.-
 1
1 -
2
-
3
-
4
-
5
-
6
-
7
-
8
-
9
-
10
-
11
-
12
-
13
-
14
-
15
-
16
-
17
-
18
-
19
-
20
-
21
-
22
-
23
-
24
-
25
-
26
-
27
-
28
-
29
-
30
-
31
-
32
-
33
-
34
-
35
-
36
-
37
-
38
-
39
-
40
-
41
-
42
-
43
-
44
-
45
-
46
-
47
-
48
-
49
-
50
-
51
-
52
-
53
-
54
-
55
-
56
-
57
-
58
-
59
-
60
-
61
-
62
-
63
-
64
-
65
-
66
-
67
-
68
-
69
-
70
-
71
-
72
-
73
-
74
-
75
-
76
-
77
-
78
-
79
-
80
-
81
-
82
-
83
-
84
-
85
-
86
-
87
-
88
-
89
-
90
-
91
-
92
-
 93
93 -
 94
94 -
 95
95 -
 96
96 -
 97
97 -
 98
98 -
 99
99 -
 100
100 -
 101
101 -
 102
102 -
 103
103 -
 104
104 -
 105
105 -
 106
106 -
 107
107 -
 108
108 -
 109
109 -
 110
110 -
 111
111 -
 112
112 -
 113
113 -
114
-
115
-
116
-
117
-
118
-
119
-
120
-
121
-
122
-
123
-
124
-
125
-
126
-
127
-
128
-
129
-
130
-
131
-
132
-
133
-
134
-
135
-
136
-
137
-
138
-
139
-
140
-
141
-
142
-
143
-
144
-
145
-
146
-
147
-
148
-
149
-
150
-
151
-
152
-
153
-
154
-
155
-
156
-
157
-
158
-
159
-
160
-
161
-
162
-
163
-
164
-
165
-
166
-
167
-
168
-
169
-
170
-
171
-
172
-
173
-
174
-
175
-
176
-
177
-
178
-
179
-
180
-
181
-
182
-
183
-
184
-
185
-
186
-
187
-
188
-
189
-
190
-
191
-
192
-
193
-
194
-
195
-
196
-
197
-
198
-
199
-
200
-
201
-
202
-
203
-
204
-
205
-
206
-
207
-
208
-
209
-
210
-
211
-
212
-
213
-
214
-
215
-
216
-
217
-
218
-
219
-
220
-
221
-
222
-
223
-
224
-
225
-
226
-
227
-
228
-
229
-
230
-
231
-
232
-
233
-
234
-
235
-
236
-
237
-
238
-
239
-
240
-
241
-
242
-
243
-
244
-
245
-
246
-
247
-
248
-
249
-
250
-
251
-
252
-
253
-
254
-
255
-
256
-
257
-
258
-
259
-
260
-
261
-
262
-
263
-
264
-
265
-
266
-
267
-
268
-
269
-
270
-
271
-
272
-
273
-
274
-
275
-
276
-
277
-
278
-
279
-
280
-
281
-
282
-
283
-
284
-
285
-
286
-
287
-
288
-
289
-
290
-
291
-
292
-
293
-
294
-
295
-
296
-
297
-
298
-
299
-
300
-
301
-
302
-
303
-
304
-
305
-
306
-
307
-
308
-
309
-
310
-
311
-
312
-
313
-
314
-
315
-
316
-
317
-
318
-
319
-
320
-
321
-
322
-
323
-
324
-
325
-
326
-
327
-
328
-
329
-
330
-
331
-
332
-
333
-
334
-
335
-
336
-
337
-
338
-
339
-
340
-
341
-
342
-
343
-
344
-
345
-
346
-
347
-
348
-
349
-
350
-
351
-
352
-
353
-
354
-
355
-
356
-
357
-
358
-
359
-
360
-
361
-
362
-
363
-
364
-
365
-
366
-
367
-
368
-
369
-
370
-
371
-
372
-
373
-
374
-
375
-
376
-
377
-
378
-
379
-
380
-
381
-
382
-
383
-
384
-
385
-
386
-
387
-
388
-
389
-
390
-
391
-
392
-
393
-
394
-
395
-
396
 |
 |
101
Overview Operating & Financial Review Governance Financial Statements Shareholder Information
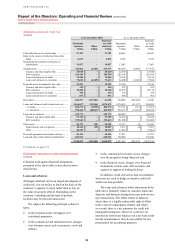
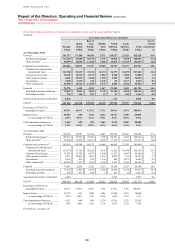
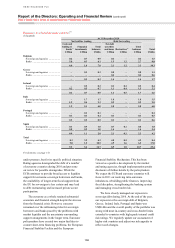
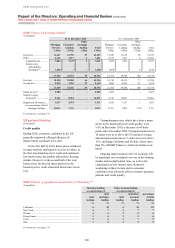
Loans and advances to banks by geographical region
(Audited)
Europe
Hong
Kong
Rest of
Asia-
Pacific
Middle
East
North
America
Latin
America
Loans and
advances
to banks
Impair-
ment
allowances
US$m US$m US$m US$m US$m US$m US$m US$m
At 31 December 20108 ....................... 78,239 33,585 40,437 9,335 19,479 27,354 208,429 (158)
At 31 December 2009 .......................... 65,614 36,197 35,648 8,435 15,386 18,608 179,888 (107)
At 31 December 2008 .......................... 62,012 29,646 28,665 7,476 11,458 14,572 153,829 (63)
At 31 December 2007 .......................... 104,534 63,737 32,373 7,488 16,566 12,675 237,373 (7)
At 31 December 2006 .......................... 76,837 50,359 19,716 7,801 17,865 12,634 185,212 (7)
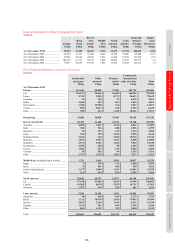
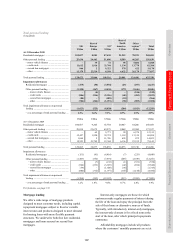
Gross loans and advances to customers by country
(Audited)
Residential
mortgages
US$m
Other
personal
US$m
Property-
related
US$m
Commercial,
international
trade and other
US$m
Total
US$m
At 31 December 2010
Europe ............................................................ 111,618 50,099 37,030 242,715 441,462
UK ................................................................... 103,037 25,636 26,002 165,283 319,958
France ............................................................. 3,749 9,550 8,737 56,613 78,649
Germany ......................................................... 11 356 79 4,015 4,461
Malta ............................................................... 1,656 599 563 1,643 4,461
Switzerland ..................................................... 1,358 10,708 114 1,837 14,017
Turkey ............................................................. 809 2,817 210 2,783 6,619
Other ............................................................... 998 433 1,325 10,541 13,297
Hong Kong ..................................................... 42,488 14,820 34,910 49,102 141,320
Rest of Asia-Pacific ....................................... 28,724 11,460 14,158 55,348 109,690
Australia .......................................................... 8,405 1,267 2,346 4,867 16,885
India ................................................................ 920 526 680 4,583 6,709
Indonesia ......................................................... 74 531 115 3,374 4,094
Japan ............................................................... 226 199 1,214 2,503 4,142
Mainland China .............................................. 2,046 310 3,836 12,932 19,124
Malaysia .......................................................... 3,833 2,053 1,361 4,845 12,092
Singapore ........................................................ 6,571 3,661 3,262 7,846 21,340
South Korea .................................................... 2,295 248 58 2,494 5,095
Taiwan ............................................................ 3,002 527 135 2,832 6,496
Vietnam ........................................................... 35 162 59 1,255 1,511
Other ............................................................... 1,317 1,976 1,092 7,817 12,202
Middle East (excluding Saudi Arabia)........... 1,751 3,620 2,870 18,037 26,278
Egypt ............................................................... 3 396 111 2,484 2,994
Qatar ............................................................... 8 491 404 918 1,821
United Arab Emirates ..................................... 1,477 2,099 1,359 11,043 15,978
Other ............................................................... 263 634 996 3,592 5,485
North America .............................................. 78,842 60,275 13,877 46,708 199,702
US ................................................................... 57,630 51,686 8,269 31,496 149,081
Canada ............................................................ 19,505 8,070 5,079 14,711 47,365
Bermuda .......................................................... 1,707 519 529 501 3,256
Latin America ............................................... 5,258 16,365 3,873 34,501 59,997
Argentina ........................................................ 30 918 103 2,172 3,223
Brazil ............................................................... 1,111 10,979 1,816 17,093 30,999
Mexico ............................................................ 2,097 2,365 1,146 8,622 14,230
Panama ............................................................ 1,155 982 489 3,794 6,420
Other ............................................................... 865 1,121 319 2,820 5,125
Total ................................................................ 268,681 156,639 106,718 446,411 978,449