HSBC 2010 Annual Report Download - page 130
Download and view the complete annual report
Please find page 130 of the 2010 HSBC annual report below. You can navigate through the pages in the report by either clicking on the pages listed below, or by using the keyword search tool below to find specific information within the annual report.-
 1
1 -
2
-
3
-
4
-
5
-
6
-
7
-
8
-
9
-
10
-
11
-
12
-
13
-
14
-
15
-
16
-
17
-
18
-
19
-
20
-
21
-
22
-
23
-
24
-
25
-
26
-
27
-
28
-
29
-
30
-
31
-
32
-
33
-
34
-
35
-
36
-
37
-
38
-
39
-
40
-
41
-
42
-
43
-
44
-
45
-
46
-
47
-
48
-
49
-
50
-
51
-
52
-
53
-
54
-
55
-
56
-
57
-
58
-
59
-
60
-
61
-
62
-
63
-
64
-
65
-
66
-
67
-
68
-
69
-
70
-
71
-
72
-
73
-
74
-
75
-
76
-
77
-
78
-
79
-
80
-
81
-
82
-
83
-
84
-
85
-
86
-
87
-
88
-
89
-
90
-
91
-
92
-
93
-
94
-
95
-
96
-
97
-
98
-
99
-
100
-
101
-
102
-
103
-
104
-
105
-
106
-
107
-
108
-
109
-
110
-
111
-
112
-
113
-
114
-
115
-
116
-
117
-
118
-
119
-
 120
120 -
 121
121 -
 122
122 -
 123
123 -
 124
124 -
 125
125 -
 126
126 -
 127
127 -
 128
128 -
 129
129 -
 130
130 -
 131
131 -
 132
132 -
 133
133 -
 134
134 -
 135
135 -
 136
136 -
 137
137 -
 138
138 -
 139
139 -
 140
140 -
141
-
142
-
143
-
144
-
145
-
146
-
147
-
148
-
149
-
150
-
151
-
152
-
153
-
154
-
155
-
156
-
157
-
158
-
159
-
160
-
161
-
162
-
163
-
164
-
165
-
166
-
167
-
168
-
169
-
170
-
171
-
172
-
173
-
174
-
175
-
176
-
177
-
178
-
179
-
180
-
181
-
182
-
183
-
184
-
185
-
186
-
187
-
188
-
189
-
190
-
191
-
192
-
193
-
194
-
195
-
196
-
197
-
198
-
199
-
200
-
201
-
202
-
203
-
204
-
205
-
206
-
207
-
208
-
209
-
210
-
211
-
212
-
213
-
214
-
215
-
216
-
217
-
218
-
219
-
220
-
221
-
222
-
223
-
224
-
225
-
226
-
227
-
228
-
229
-
230
-
231
-
232
-
233
-
234
-
235
-
236
-
237
-
238
-
239
-
240
-
241
-
242
-
243
-
244
-
245
-
246
-
247
-
248
-
249
-
250
-
251
-
252
-
253
-
254
-
255
-
256
-
257
-
258
-
259
-
260
-
261
-
262
-
263
-
264
-
265
-
266
-
267
-
268
-
269
-
270
-
271
-
272
-
273
-
274
-
275
-
276
-
277
-
278
-
279
-
280
-
281
-
282
-
283
-
284
-
285
-
286
-
287
-
288
-
289
-
290
-
291
-
292
-
293
-
294
-
295
-
296
-
297
-
298
-
299
-
300
-
301
-
302
-
303
-
304
-
305
-
306
-
307
-
308
-
309
-
310
-
311
-
312
-
313
-
314
-
315
-
316
-
317
-
318
-
319
-
320
-
321
-
322
-
323
-
324
-
325
-
326
-
327
-
328
-
329
-
330
-
331
-
332
-
333
-
334
-
335
-
336
-
337
-
338
-
339
-
340
-
341
-
342
-
343
-
344
-
345
-
346
-
347
-
348
-
349
-
350
-
351
-
352
-
353
-
354
-
355
-
356
-
357
-
358
-
359
-
360
-
361
-
362
-
363
-
364
-
365
-
366
-
367
-
368
-
369
-
370
-
371
-
372
-
373
-
374
-
375
-
376
-
377
-
378
-
379
-
380
-
381
-
382
-
383
-
384
-
385
-
386
-
387
-
388
-
389
-
390
-
391
-
392
-
393
-
394
-
395
-
396
 |
 |

HSBC HOLDINGS PLC
Report of the Directors: Operating and Financial Review (continued)
Risk > Credit risk > Securitisation exposures and other structured products
128
All of the derivative transactions are with HSBC
undertakings which are banking counterparties
(2009: 100%).
The credit quality of the loans and advances to
HSBC undertakings is assessed as strong/good, with
100% of the exposure being neither past due nor
impaired (2009: 100%).
The credit ratings of the financial investments
held by HSBC Holdings are within the Standard and
Poor’s (‘S&P’) ratings range of A to BBB+ (2009:
A+ to A–).
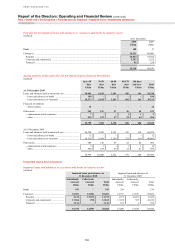
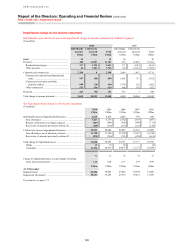
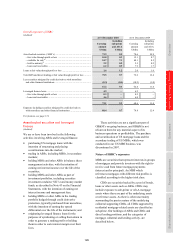
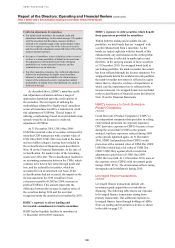
Securitisation exposures and other
structured products
(Audited)
The financial impact of the recent market disruption
is lessening with net write-downs to the income
statement of nil (2009: US$1.9bn net write-downs)
and a reduction in the available-for-sale ABSs
reserve deficit by US$5.8bn to US$6.4bn.
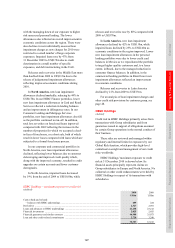
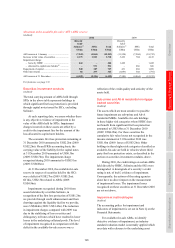
Following the dislocation in markets which
began in 2007, there was a modest recovery in the
risk appetite of investors in 2009. However, the first
half of 2010 saw renewed uncertainty and concerns
over sovereign credit risk. As a result, the prices of
many assets perceived to be of higher risk fell. In
addition, the widespread downgrading of securitised
assets continued in the first half of 2010 as rating
agencies changed their methodologies, reducing the
appetite for securitised assets among institutions
subject to the Basel II framework.
Increased stability returned in the second half of
2010 following the interventions of the EU and the
International Monetary Fund. A modest increase in
house prices in some areas and the continued low
interest rate environment contributed to a rise in the
price of some securitised assets. As a result, the
levels of write-downs and losses on our holdings of
structured assets remained modest. Unrealised losses
in our available-for-sale reserve continued to reduce
due to increases in fair value and the principal
amortisation of ABSs as repayments were received
at par. Expectations of cash losses on available-for-
sale ABSs remained consistent with our previous
estimates.
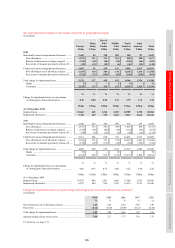
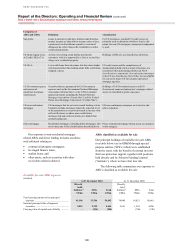
Overview of exposure
(Audited)
Accounting policies
Our accounting policies for the classification and valuation of
financial instruments are in accordance with the requirements
of IAS 32 ‘Financial Instruments: Presentation’ and IAS 39
‘Financial Instruments: Recognition and Measurement’, as
described in Note 2 on the Financial Statements, and the use of
assumptions and estimates in respect of valuation of financial
instruments as described in Note 16 on the Financial
Statements.
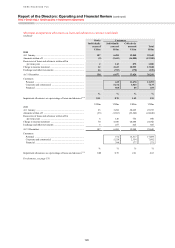
This section contains information about our exposure
to the following:
• ABSs, including mortgage-backed securities
(‘MBS’s) and related collateralised debt
obligations (‘CDO’s);
• direct lending held at fair value through profit or
loss;
• monolines;
• credit derivative product companies (‘CDPC’s);
• leveraged finance transactions; and
• representations and warranties related to
mortgage sales and securitisation activities.
The following table summarises our exposure to
these products.