HSBC 2010 Annual Report Download - page 275
Download and view the complete annual report
Please find page 275 of the 2010 HSBC annual report below. You can navigate through the pages in the report by either clicking on the pages listed below, or by using the keyword search tool below to find specific information within the annual report.-
 1
1 -
2
-
3
-
4
-
5
-
6
-
7
-
8
-
9
-
10
-
11
-
12
-
13
-
14
-
15
-
16
-
17
-
18
-
19
-
20
-
21
-
22
-
23
-
24
-
25
-
26
-
27
-
28
-
29
-
30
-
31
-
32
-
33
-
34
-
35
-
36
-
37
-
38
-
39
-
40
-
41
-
42
-
43
-
44
-
45
-
46
-
47
-
48
-
49
-
50
-
51
-
52
-
53
-
54
-
55
-
56
-
57
-
58
-
59
-
60
-
61
-
62
-
63
-
64
-
65
-
66
-
67
-
68
-
69
-
70
-
71
-
72
-
73
-
74
-
75
-
76
-
77
-
78
-
79
-
80
-
81
-
82
-
83
-
84
-
85
-
86
-
87
-
88
-
89
-
90
-
91
-
92
-
93
-
94
-
95
-
96
-
97
-
98
-
99
-
100
-
101
-
102
-
103
-
104
-
105
-
106
-
107
-
108
-
109
-
110
-
111
-
112
-
113
-
114
-
115
-
116
-
117
-
118
-
119
-
120
-
121
-
122
-
123
-
124
-
125
-
126
-
127
-
128
-
129
-
130
-
131
-
132
-
133
-
134
-
135
-
136
-
137
-
138
-
139
-
140
-
141
-
142
-
143
-
144
-
145
-
146
-
147
-
148
-
149
-
150
-
151
-
152
-
153
-
154
-
155
-
156
-
157
-
158
-
159
-
160
-
161
-
162
-
163
-
164
-
165
-
166
-
167
-
168
-
169
-
170
-
171
-
172
-
173
-
174
-
175
-
176
-
177
-
178
-
179
-
180
-
181
-
182
-
183
-
184
-
185
-
186
-
187
-
188
-
189
-
190
-
191
-
192
-
193
-
194
-
195
-
196
-
197
-
198
-
199
-
200
-
201
-
202
-
203
-
204
-
205
-
206
-
207
-
208
-
209
-
210
-
211
-
212
-
213
-
214
-
215
-
216
-
217
-
218
-
219
-
220
-
221
-
222
-
223
-
224
-
225
-
226
-
227
-
228
-
229
-
230
-
231
-
232
-
233
-
234
-
235
-
236
-
237
-
238
-
239
-
240
-
241
-
242
-
243
-
244
-
245
-
246
-
247
-
248
-
249
-
250
-
251
-
252
-
253
-
254
-
255
-
256
-
257
-
258
-
259
-
260
-
261
-
262
-
263
-
264
-
 265
265 -
 266
266 -
 267
267 -
 268
268 -
 269
269 -
 270
270 -
 271
271 -
 272
272 -
 273
273 -
 274
274 -
 275
275 -
 276
276 -
 277
277 -
 278
278 -
 279
279 -
 280
280 -
 281
281 -
 282
282 -
 283
283 -
 284
284 -
 285
285 -
286
-
287
-
288
-
289
-
290
-
291
-
292
-
293
-
294
-
295
-
296
-
297
-
298
-
299
-
300
-
301
-
302
-
303
-
304
-
305
-
306
-
307
-
308
-
309
-
310
-
311
-
312
-
313
-
314
-
315
-
316
-
317
-
318
-
319
-
320
-
321
-
322
-
323
-
324
-
325
-
326
-
327
-
328
-
329
-
330
-
331
-
332
-
333
-
334
-
335
-
336
-
337
-
338
-
339
-
340
-
341
-
342
-
343
-
344
-
345
-
346
-
347
-
348
-
349
-
350
-
351
-
352
-
353
-
354
-
355
-
356
-
357
-
358
-
359
-
360
-
361
-
362
-
363
-
364
-
365
-
366
-
367
-
368
-
369
-
370
-
371
-
372
-
373
-
374
-
375
-
376
-
377
-
378
-
379
-
380
-
381
-
382
-
383
-
384
-
385
-
386
-
387
-
388
-
389
-
390
-
391
-
392
-
393
-
394
-
395
-
396
 |
 |
273
Overview Operating & Financial Review Governance Financial Statements Shareholder Information
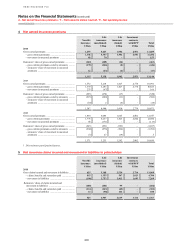
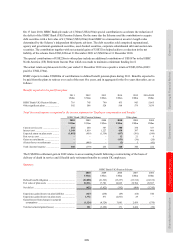
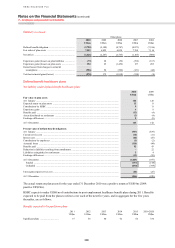
Non-life
insurance
Life
insurance
(non-linked)
Life
insurance
(linked)
Investment
contracts
with DPF1 Total
US$m US$m US$m US$m US$m
2009
Gross claims incurred and movement in liabilities ........... 1,281 4,669 2,676 3,934 12,560
– claims, benefits and surrenders paid ..................... 987 2,098 325 1,818 5,228
– movement in liabilities .......................................... 294 2,571 2,351 2,116 7,332
Reinsurers’ share of claims incurred and
movement in liabilities ............................................ (158) (98) 146 – (110)
– claims, benefits and surrenders paid ..................... (156) (159) (21) – (336)
– movement in liabilities .......................................... (2) 61 167 – 226
1,123 4,571 2,822 3,934 12,450
2008
Gross claims incurred and movement in liabilities ........... 1,044 5,480 939 1,743 9,206
– claims, benefits and surrenders paid ..................... 1,044 1,491 481 1,911 4,927
– movement in liabilities .......................................... – 3,989 458 (168) 4,279
Reinsurers’ share of claims incurred and
movement in liabilities ............................................ (83) (792) (1,442) – (2,317)
– claims, benefits and surrenders paid ..................... (158) (172) (44) – (374)
– movement in liabilities .......................................... 75 (620) (1,398) – (1,943)
961 4,688 (503) 1,743 6,889
1 Discretionary participation features.
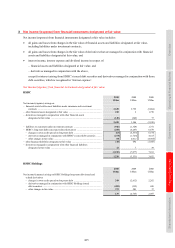
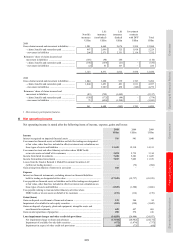
6 Net operating income
Net operating income is stated after the following items of income, expense, gains and losses:
2010 2009 2008
US$m US$m US$m
Income
Interest recognised on impaired financial assets ........................................................ 516 941 1,040
Fees earned on financial assets or liabilities not held for trading nor designated
at fair value, other than fees included in effective interest rate calculations on
these types of assets and liabilities ......................................................................... 11,445 12,310 14,511
Fees earned on trust and other fiduciary activities where HSBC holds
or invests assets on behalf of its customers ........................................................... 3,074 2,735 3,314
Income from listed investments .................................................................................. 7,418 9,201 11,425
Income from unlisted investments .............................................................................. 7,187 7,085 11,359
Losses from the fraud at Bernard L Madoff Investment Securities LLC
(within net trading income) .................................................................................... – (72) (984)
Gain arising from dilution of interests in associates .................................................. 188 – –
Expense
Interest on financial instruments, excluding interest on financial liabilities
held for trading or designated at fair value ............................................................ (17,549) (19,737) (45,525)
Fees payable on financial assets or liabilities not held for trading nor designated
at fair value, other than fees included in effective interest rate calculations on
these types of assets and liabilities ......................................................................... (1,529) (1,580) (1,866)
Fees payable relating to trust and other fiduciary activities where
HSBC holds or invests assets on behalf of its customers ...................................... (151) (116) (159)
Gains/(losses)
Gain on disposal or settlement of loans and advances ............................................... 121 244 94
Impairment of available-for-sale equity securities ..................................................... (105) (358) (1,042)
Gains on disposal of property, plant and equipment, intangible assets and
non-financial investments ...................................................................................... 639 457 465
Gain on sale/repurchase of properties ........................................................................ 250 576 416
Loan impairment charges and other credit risk provisions ................................. (14,039) (26,488) (24,937)
Net impairment charge on loans and advances ...................................................... (13,548) (24,942) (24,131)
Impairment of available-for-sale debt securities .................................................... (472) (1,474) (737)
Impairment in respect of other credit risk provisions ............................................ (19) (72) (69)