HSBC 2010 Annual Report Download - page 46
Download and view the complete annual report
Please find page 46 of the 2010 HSBC annual report below. You can navigate through the pages in the report by either clicking on the pages listed below, or by using the keyword search tool below to find specific information within the annual report.-
 1
1 -
2
-
3
-
4
-
5
-
6
-
7
-
8
-
9
-
10
-
11
-
12
-
13
-
14
-
15
-
16
-
17
-
18
-
19
-
20
-
21
-
22
-
23
-
24
-
25
-
26
-
27
-
28
-
29
-
30
-
31
-
32
-
33
-
34
-
35
-
 36
36 -
 37
37 -
 38
38 -
 39
39 -
 40
40 -
 41
41 -
 42
42 -
 43
43 -
 44
44 -
 45
45 -
 46
46 -
 47
47 -
 48
48 -
 49
49 -
 50
50 -
 51
51 -
 52
52 -
 53
53 -
 54
54 -
 55
55 -
 56
56 -
57
-
58
-
59
-
60
-
61
-
62
-
63
-
64
-
65
-
66
-
67
-
68
-
69
-
70
-
71
-
72
-
73
-
74
-
75
-
76
-
77
-
78
-
79
-
80
-
81
-
82
-
83
-
84
-
85
-
86
-
87
-
88
-
89
-
90
-
91
-
92
-
93
-
94
-
95
-
96
-
97
-
98
-
99
-
100
-
101
-
102
-
103
-
104
-
105
-
106
-
107
-
108
-
109
-
110
-
111
-
112
-
113
-
114
-
115
-
116
-
117
-
118
-
119
-
120
-
121
-
122
-
123
-
124
-
125
-
126
-
127
-
128
-
129
-
130
-
131
-
132
-
133
-
134
-
135
-
136
-
137
-
138
-
139
-
140
-
141
-
142
-
143
-
144
-
145
-
146
-
147
-
148
-
149
-
150
-
151
-
152
-
153
-
154
-
155
-
156
-
157
-
158
-
159
-
160
-
161
-
162
-
163
-
164
-
165
-
166
-
167
-
168
-
169
-
170
-
171
-
172
-
173
-
174
-
175
-
176
-
177
-
178
-
179
-
180
-
181
-
182
-
183
-
184
-
185
-
186
-
187
-
188
-
189
-
190
-
191
-
192
-
193
-
194
-
195
-
196
-
197
-
198
-
199
-
200
-
201
-
202
-
203
-
204
-
205
-
206
-
207
-
208
-
209
-
210
-
211
-
212
-
213
-
214
-
215
-
216
-
217
-
218
-
219
-
220
-
221
-
222
-
223
-
224
-
225
-
226
-
227
-
228
-
229
-
230
-
231
-
232
-
233
-
234
-
235
-
236
-
237
-
238
-
239
-
240
-
241
-
242
-
243
-
244
-
245
-
246
-
247
-
248
-
249
-
250
-
251
-
252
-
253
-
254
-
255
-
256
-
257
-
258
-
259
-
260
-
261
-
262
-
263
-
264
-
265
-
266
-
267
-
268
-
269
-
270
-
271
-
272
-
273
-
274
-
275
-
276
-
277
-
278
-
279
-
280
-
281
-
282
-
283
-
284
-
285
-
286
-
287
-
288
-
289
-
290
-
291
-
292
-
293
-
294
-
295
-
296
-
297
-
298
-
299
-
300
-
301
-
302
-
303
-
304
-
305
-
306
-
307
-
308
-
309
-
310
-
311
-
312
-
313
-
314
-
315
-
316
-
317
-
318
-
319
-
320
-
321
-
322
-
323
-
324
-
325
-
326
-
327
-
328
-
329
-
330
-
331
-
332
-
333
-
334
-
335
-
336
-
337
-
338
-
339
-
340
-
341
-
342
-
343
-
344
-
345
-
346
-
347
-
348
-
349
-
350
-
351
-
352
-
353
-
354
-
355
-
356
-
357
-
358
-
359
-
360
-
361
-
362
-
363
-
364
-
365
-
366
-
367
-
368
-
369
-
370
-
371
-
372
-
373
-
374
-
375
-
376
-
377
-
378
-
379
-
380
-
381
-
382
-
383
-
384
-
385
-
386
-
387
-
388
-
389
-
390
-
391
-
392
-
393
-
394
-
395
-
396
 |
 |

HSBC HOLDINGS PLC
Report of the Directors: Operating and Financial Review (continued)
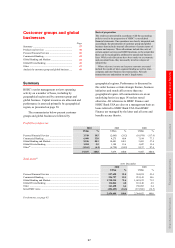
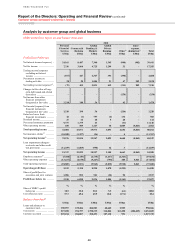
Customer groups and global businesses > GB&M
44
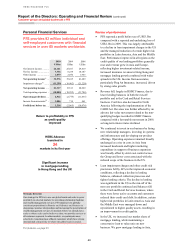
Global Banking and Markets
GB&M is a global business which
provides tailored financial solutions
to major government, corporate and
institutional clients worldwide.
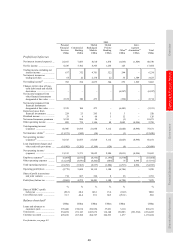
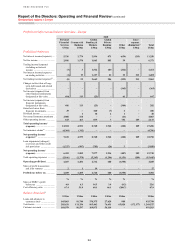
2010 2009 2008
US$m US$m US$m
Net interest income ........... 7,348 8,610 8,541
Net fee income .................. 4,725 4,363 4,291
Net trading income49 ......... 5,831 6,875 481
Other income ..................... 2,043 1,972 205
Net operating income46 ... 19,947 21,820 13,518
Impairment charges47 ........ (990) (3,168) (1,471)
Net operating income ..... 18,957 18,652 12,047
Total operating expenses .. (9,962) (8,537) (9,092)
Operating profit .............. 8,995 10,115 2,955
Income from associates48 ... 541 366 528
Profit before tax .............. 9,536 10,481 3,483
Employee expenses (including
payroll and bonus taxes)
in operating expenses
US$4,737m
(2009: US$4,335m: 2008: US$4,263m)
Strong contribution from
emerging markets
Best Global Emerging
Markets Bank
Best Global Emerging
Markets Debt House
Best Debt House
in Asia
Euromoney Awards
for Excellence 2010
Emerging Markets
Bond House of the Year
International Financing
Review Awards 2010
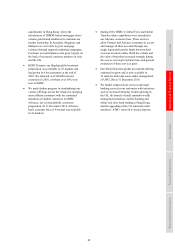
Strategic direction
In 2010, GB&M continued to pursue its now well-established
‘emerging markets-led and financing-focused’ strategy,
encompassing HSBC’s objective to be a leading wholesale bank
by:
• utilising the Group’s extensive distribution network;
• developing GB&M’s hub-and-spoke business model; and
• continuing to build capabilities in major hubs to support the
delivery of an advanced suite of services to major government,
corporate and institutional clients across the HSBC network.
This combination of product depth and distribution strength is
fundamental to meeting the needs of existing and new clients and
allowing GB&M to achieve its strategic goals.
For footnotes, see page 83.
Review of performance
• GB&M reported profit before tax of US$9.5bn,
9% lower than in 2009. On an underlying basis,
which excludes the gains resulting from the sale
of Eversholt Rail Group and HSBC Private
Equity (Asia) Ltd in 2010, profit before tax
declined by 14%, driven by lower income from
Balance Sheet Management and Credit and
Rates trading and higher operating costs.
Profitability benefited from a significant
reduction in loan impairment charges and
other credit risk provisions. Operating results
remained well diversified across our businesses
with a strong contribution from emerging
markets, where we continued to support existing
and anticipated new business, including
introducing a ‘China desk’ in the Middle East
and a ‘Latam desk’ in Hong Kong.
• Net operating income before loan impairment
charges and other credit risk provisions
decreased by 11%, mainly due to lower net
interest income in Balance Sheet Management
from the maturing of higher yielding positions,
low interest rates and flattening yield curves.
Lower trading income largely reflected
uncertainty in the eurozone, particularly in the
second half of 2010. This was offset in part by
a net release of US$429m largely relating to
legacy positions in Credit trading and monoline
Credit exposures, compared with a reported
write-down of US$331m in 2009, following a
general improvement in ABS prices. Trading
income also benefited from a small favourable
fair value movement on structured liabilities,
compared with an adverse fair value movement
in 2009, resulting in a reported favourable
movement of US$466m.
• Loan impairment charges and other credit risk
provisions decreased by US$2.2bn. A US$1.2bn
reduction in loan impairment charges to
US$500m was driven by a general improvement
in the credit environment and the non-recurrence
of significant charges taken in relation to a small
number of clients in 2009. Credit risk provisions
on the available-for-sale portfolio decreased by
US$981m to US$490m, of which US$444m
related to ABSs, significantly lower than the
US$1.5bn impairment reported in 2009, due to
a slowing in the rate of anticipated losses in the
underlying collateral pools.
• Higher operating expenses in 2010 reflected the
one-off payroll and bonus taxes in the UK and
France on certain bonuses paid in respect of
2009 totalling US$309m, the non-recurrence of
an accounting gain related to a change in the