HSBC 2010 Annual Report Download - page 26
Download and view the complete annual report
Please find page 26 of the 2010 HSBC annual report below. You can navigate through the pages in the report by either clicking on the pages listed below, or by using the keyword search tool below to find specific information within the annual report.-
 1
1 -
2
-
3
-
4
-
5
-
6
-
7
-
8
-
9
-
10
-
11
-
12
-
13
-
14
-
15
-
 16
16 -
 17
17 -
 18
18 -
 19
19 -
 20
20 -
 21
21 -
 22
22 -
 23
23 -
 24
24 -
 25
25 -
 26
26 -
 27
27 -
 28
28 -
 29
29 -
 30
30 -
 31
31 -
 32
32 -
 33
33 -
 34
34 -
 35
35 -
 36
36 -
37
-
38
-
39
-
40
-
41
-
42
-
43
-
44
-
45
-
46
-
47
-
48
-
49
-
50
-
51
-
52
-
53
-
54
-
55
-
56
-
57
-
58
-
59
-
60
-
61
-
62
-
63
-
64
-
65
-
66
-
67
-
68
-
69
-
70
-
71
-
72
-
73
-
74
-
75
-
76
-
77
-
78
-
79
-
80
-
81
-
82
-
83
-
84
-
85
-
86
-
87
-
88
-
89
-
90
-
91
-
92
-
93
-
94
-
95
-
96
-
97
-
98
-
99
-
100
-
101
-
102
-
103
-
104
-
105
-
106
-
107
-
108
-
109
-
110
-
111
-
112
-
113
-
114
-
115
-
116
-
117
-
118
-
119
-
120
-
121
-
122
-
123
-
124
-
125
-
126
-
127
-
128
-
129
-
130
-
131
-
132
-
133
-
134
-
135
-
136
-
137
-
138
-
139
-
140
-
141
-
142
-
143
-
144
-
145
-
146
-
147
-
148
-
149
-
150
-
151
-
152
-
153
-
154
-
155
-
156
-
157
-
158
-
159
-
160
-
161
-
162
-
163
-
164
-
165
-
166
-
167
-
168
-
169
-
170
-
171
-
172
-
173
-
174
-
175
-
176
-
177
-
178
-
179
-
180
-
181
-
182
-
183
-
184
-
185
-
186
-
187
-
188
-
189
-
190
-
191
-
192
-
193
-
194
-
195
-
196
-
197
-
198
-
199
-
200
-
201
-
202
-
203
-
204
-
205
-
206
-
207
-
208
-
209
-
210
-
211
-
212
-
213
-
214
-
215
-
216
-
217
-
218
-
219
-
220
-
221
-
222
-
223
-
224
-
225
-
226
-
227
-
228
-
229
-
230
-
231
-
232
-
233
-
234
-
235
-
236
-
237
-
238
-
239
-
240
-
241
-
242
-
243
-
244
-
245
-
246
-
247
-
248
-
249
-
250
-
251
-
252
-
253
-
254
-
255
-
256
-
257
-
258
-
259
-
260
-
261
-
262
-
263
-
264
-
265
-
266
-
267
-
268
-
269
-
270
-
271
-
272
-
273
-
274
-
275
-
276
-
277
-
278
-
279
-
280
-
281
-
282
-
283
-
284
-
285
-
286
-
287
-
288
-
289
-
290
-
291
-
292
-
293
-
294
-
295
-
296
-
297
-
298
-
299
-
300
-
301
-
302
-
303
-
304
-
305
-
306
-
307
-
308
-
309
-
310
-
311
-
312
-
313
-
314
-
315
-
316
-
317
-
318
-
319
-
320
-
321
-
322
-
323
-
324
-
325
-
326
-
327
-
328
-
329
-
330
-
331
-
332
-
333
-
334
-
335
-
336
-
337
-
338
-
339
-
340
-
341
-
342
-
343
-
344
-
345
-
346
-
347
-
348
-
349
-
350
-
351
-
352
-
353
-
354
-
355
-
356
-
357
-
358
-
359
-
360
-
361
-
362
-
363
-
364
-
365
-
366
-
367
-
368
-
369
-
370
-
371
-
372
-
373
-
374
-
375
-
376
-
377
-
378
-
379
-
380
-
381
-
382
-
383
-
384
-
385
-
386
-
387
-
388
-
389
-
390
-
391
-
392
-
393
-
394
-
395
-
396
 |
 |

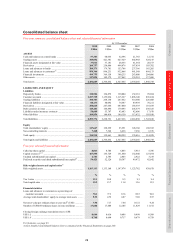
HSBC HOLDINGS PLC
Report of the Directors: Operating and Financial Review (continued)
Financial summary > Group performance
24
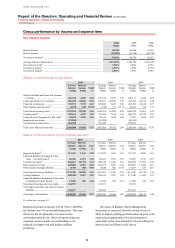
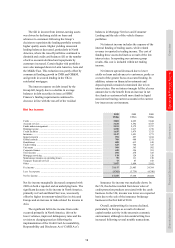
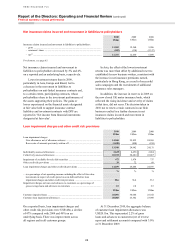
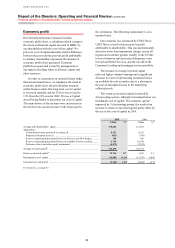
Net insurance claims incurred and movement in liabilities to policyholders
2010
US$m
2009
US$m
2008
US$m
Insurance claims incurred and movement in liabilities to policyholders:
– gross .................................................................................................................... 11,969 12,560 9,206
– reinsurers’ share ................................................................................................. (202) (110) (2,317)
– net34 ..................................................................................................................... 11,767 12,450 6,889
For footnote, see page 83.
Net insurance claims incurred and movement in
liabilities to policyholders decreased by 5% and 4%
on a reported and an underlying basis, respectively.
Lower investment returns than in 2009,
particularly in Asia, Europe and Brazil, led to
a decrease in the movement in liabilities to
policyholders on unit-linked insurance contracts and,
to a certain extent, participating contracts, whose
policyholders share in the investment performance of
the assets supporting their policies. The gains or
losses experienced on the financial assets designated
at fair value held to support insurance contract
liabilities and investment contracts with DPF are
reported in ‘Net income from financial instruments
designated at fair value’.
In Asia, the effect of the lower investment
returns was more than offset by additional reserves
established for new business written, consistent with
the increase in net insurance premiums earned,
particularly in Hong Kong, as a result of successful
sales campaigns and the recruitment of additional
insurance sales managers.
In addition, the increase in reserves in 2009 on
the now closed UK motor insurance book, which
reflected the rising incidence and severity of claims
at that time, did not recur. The decision taken in
2010 not to renew certain contracts in our Irish
business resulted in a further decrease in net
insurance claims incurred and movement in
liabilities to policyholders.
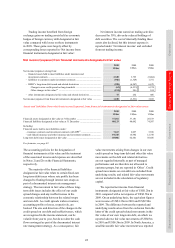
Loan impairment charges and other credit risk provisions
2010
US$m
2009
US$m
2008
US$m
Loan impairment charges
New allowances net of allowance releases ............................................................ 14,568 25,832 24,965
Recoveries of amounts previously written off ....................................................... (1,020) (890) (834)
13,548 24,942 24,131
Individually assessed allowances ............................................................................... 2,625 4,458 2,064
Collectively assessed allowances ............................................................................... 10,923 20,484 22,067
Impairment of available-for-sale debt securities ........................................................ 472 1,474 737
Other credit risk provisions ........................................................................................ 19 72 69
Loan impairment charges and other credit risk provisions ........................................ 14,039 26,488 24,937
% % %
– as a percentage of net operating income excluding the effect of fair value
movements in respect of credit spread on own debt and before loan
impairment charges and other credit risk provisions ............................................. 20.6 36.4 33.2
Impairment charges on loans and advances to customers as a percentage of
gross average loans and advances to customers .................................................... 1.5 2.8 2.5
US$m US$m US$m
Customer impaired loans ............................................................................................ 28,091 30,606 25,352
Customer loan impairment allowances ...................................................................... 20,083 25,542 23,909
On a reported basis, loan impairment charges and
other credit risk provisions were US$14bn, a decline
of 47% compared with 2009 and 48% on an
underlying basis. There was improvement across
all regions and in all customer groups.
At 31 December 2010, the aggregate balance
of customer loan impairment allowances was
US$20.1bn. This represented 2.2% of gross
loans and advances to customers (net of reverse
repos and settlement accounts) compared with 3.0%
at 31 December 2009.