HSBC 2010 Annual Report Download - page 278
Download and view the complete annual report
Please find page 278 of the 2010 HSBC annual report below. You can navigate through the pages in the report by either clicking on the pages listed below, or by using the keyword search tool below to find specific information within the annual report.-
 1
1 -
2
-
3
-
4
-
5
-
6
-
7
-
8
-
9
-
10
-
11
-
12
-
13
-
14
-
15
-
16
-
17
-
18
-
19
-
20
-
21
-
22
-
23
-
24
-
25
-
26
-
27
-
28
-
29
-
30
-
31
-
32
-
33
-
34
-
35
-
36
-
37
-
38
-
39
-
40
-
41
-
42
-
43
-
44
-
45
-
46
-
47
-
48
-
49
-
50
-
51
-
52
-
53
-
54
-
55
-
56
-
57
-
58
-
59
-
60
-
61
-
62
-
63
-
64
-
65
-
66
-
67
-
68
-
69
-
70
-
71
-
72
-
73
-
74
-
75
-
76
-
77
-
78
-
79
-
80
-
81
-
82
-
83
-
84
-
85
-
86
-
87
-
88
-
89
-
90
-
91
-
92
-
93
-
94
-
95
-
96
-
97
-
98
-
99
-
100
-
101
-
102
-
103
-
104
-
105
-
106
-
107
-
108
-
109
-
110
-
111
-
112
-
113
-
114
-
115
-
116
-
117
-
118
-
119
-
120
-
121
-
122
-
123
-
124
-
125
-
126
-
127
-
128
-
129
-
130
-
131
-
132
-
133
-
134
-
135
-
136
-
137
-
138
-
139
-
140
-
141
-
142
-
143
-
144
-
145
-
146
-
147
-
148
-
149
-
150
-
151
-
152
-
153
-
154
-
155
-
156
-
157
-
158
-
159
-
160
-
161
-
162
-
163
-
164
-
165
-
166
-
167
-
168
-
169
-
170
-
171
-
172
-
173
-
174
-
175
-
176
-
177
-
178
-
179
-
180
-
181
-
182
-
183
-
184
-
185
-
186
-
187
-
188
-
189
-
190
-
191
-
192
-
193
-
194
-
195
-
196
-
197
-
198
-
199
-
200
-
201
-
202
-
203
-
204
-
205
-
206
-
207
-
208
-
209
-
210
-
211
-
212
-
213
-
214
-
215
-
216
-
217
-
218
-
219
-
220
-
221
-
222
-
223
-
224
-
225
-
226
-
227
-
228
-
229
-
230
-
231
-
232
-
233
-
234
-
235
-
236
-
237
-
238
-
239
-
240
-
241
-
242
-
243
-
244
-
245
-
246
-
247
-
248
-
249
-
250
-
251
-
252
-
253
-
254
-
255
-
256
-
257
-
258
-
259
-
260
-
261
-
262
-
263
-
264
-
265
-
266
-
267
-
 268
268 -
 269
269 -
 270
270 -
 271
271 -
 272
272 -
 273
273 -
 274
274 -
 275
275 -
 276
276 -
 277
277 -
 278
278 -
 279
279 -
 280
280 -
 281
281 -
 282
282 -
 283
283 -
 284
284 -
 285
285 -
 286
286 -
 287
287 -
 288
288 -
289
-
290
-
291
-
292
-
293
-
294
-
295
-
296
-
297
-
298
-
299
-
300
-
301
-
302
-
303
-
304
-
305
-
306
-
307
-
308
-
309
-
310
-
311
-
312
-
313
-
314
-
315
-
316
-
317
-
318
-
319
-
320
-
321
-
322
-
323
-
324
-
325
-
326
-
327
-
328
-
329
-
330
-
331
-
332
-
333
-
334
-
335
-
336
-
337
-
338
-
339
-
340
-
341
-
342
-
343
-
344
-
345
-
346
-
347
-
348
-
349
-
350
-
351
-
352
-
353
-
354
-
355
-
356
-
357
-
358
-
359
-
360
-
361
-
362
-
363
-
364
-
365
-
366
-
367
-
368
-
369
-
370
-
371
-
372
-
373
-
374
-
375
-
376
-
377
-
378
-
379
-
380
-
381
-
382
-
383
-
384
-
385
-
386
-
387
-
388
-
389
-
390
-
391
-
392
-
393
-
394
-
395
-
396
 |
 |
HSBC HOLDINGS PLC
Notes on the Financial Statements (continued)
7 – Employee compensation and benefits
276
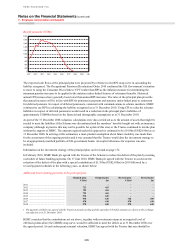
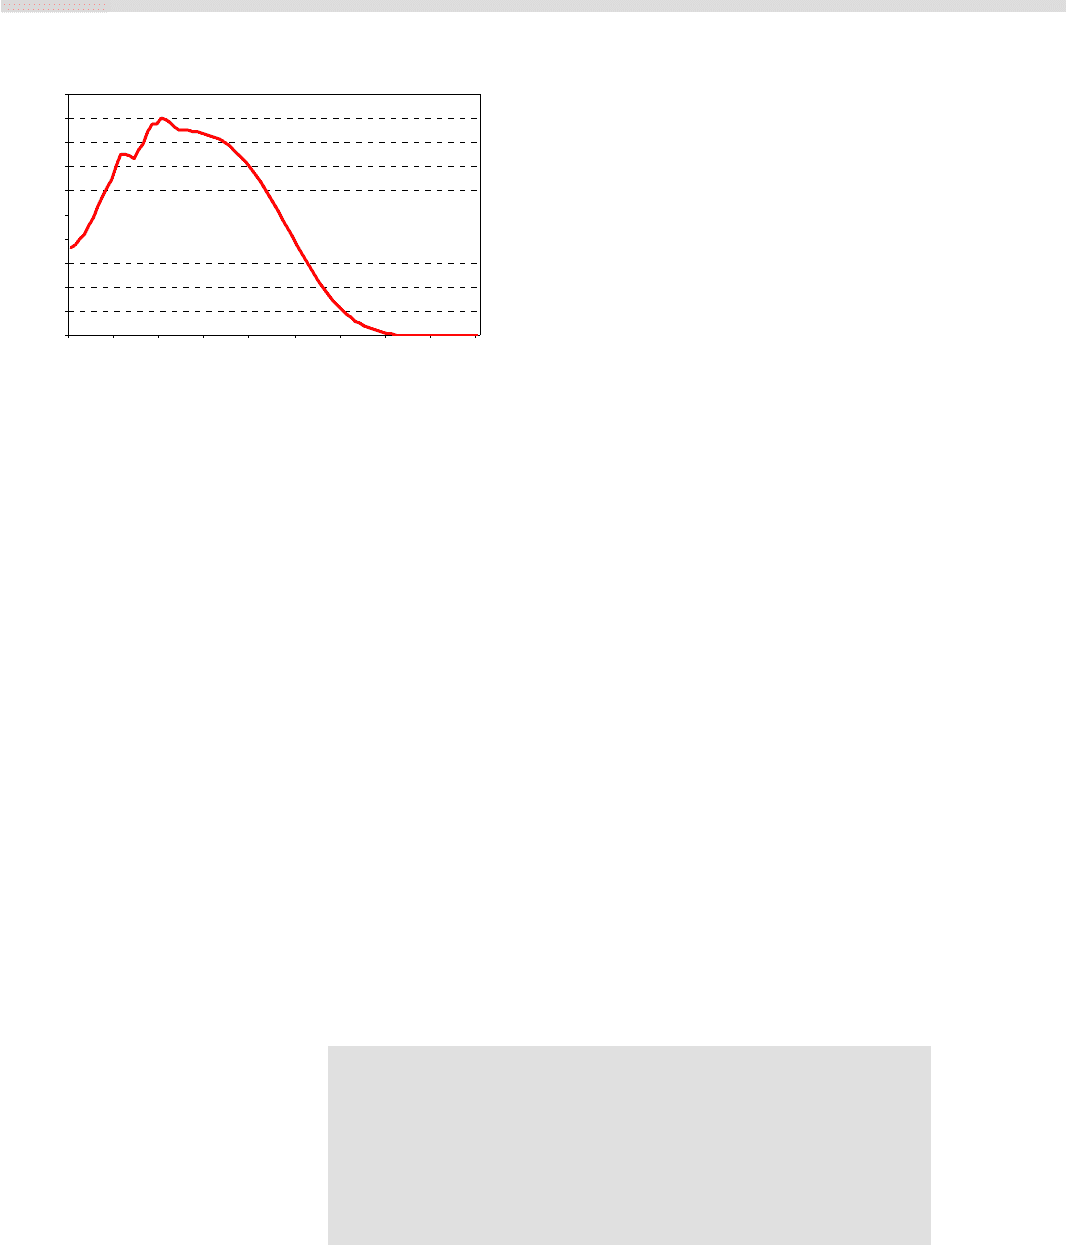
Benefit payments (US$m)
0
200
400
600
800
1, 0 0 0
1, 2 0 0
1, 4 0 0
1, 6 0 0
1, 8 0 0
2,000
2011 2021 2031 2041 2051 2061 2071 2081 2091 2101
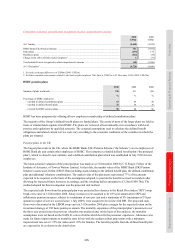
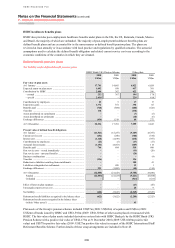
The expected cash flows of the principal plan were projected by reference to the RPI swap curve in calculating the
liability recognised. The Occupational Pensions (Revaluation) Order 2010 confirmed the UK Government’s intention
to move to using the Consumer Prices Index (‘CPI’) rather than RPI as the inflation measure for determining the
minimum pension increases to be applied to the statutory index-linked features of retirement benefits. Historical
annual CPI increases have generally been lower than annual RPI increases. The rules of the principal plan prescribe
that annual increases will be in line with RPI for pensions in payment and statutory index-linked prior to retirement
for deferred pensions. In respect of deferred pensioners, consistent with communications to scheme members, HSBC
continued to use RPI in calculating the liability recognised as at 31 December 2010. Using CPI to value the schemes
liabilities in respect of deferred pensioners would result in a reduction in the principal plan’s liabilities of
approximately US$400m based on the financial and demographic assumptions as at 31 December 2010.
As part of the 31 December 2008 valuation, calculations were also carried out as to the amount of assets that might be
needed to meet the liabilities if the Scheme was discontinued and the members’ benefits bought out with an insurance
company (although in practice this may not be possible for a plan of this size) or the Trustee continued to run the plan
without the support of HSBC. The amount required under this approach is estimated to be £19.8bn (US$28.9bn) as at
31 December 2008. In arriving at this estimation, a more prudent assumption about future mortality was made than
for the assessment of the ongoing position and it was assumed that the Trustee would alter the investment strategy to
be an appropriately matched portfolio of UK government bonds. An explicit allowance for expenses was also
included.
Information on the investment strategy of the principal plan can be found on page 172.
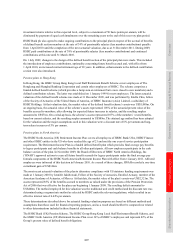
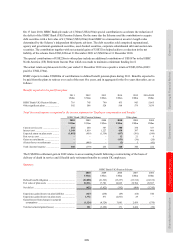
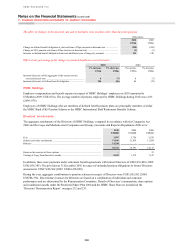
In February 2010, HSBC Bank plc agreed with the Trustee of the Scheme to reduce the deficit of the plan by meeting
a schedule of future funding payments. On 17 June 2010, HSBC Bank plc agreed with the Trustee to accelerate the
reduction of the deficit of the plan with a special contribution of £1,760m (US$2,638m) in 2010 followed by a
revised payment schedule in the following years, as shown below:
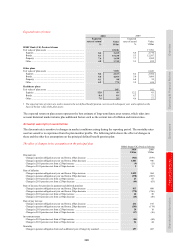
Additional future funding payments to the principal plan
Original plan Original plan Revised plan Revised plan
US$m1 £m US$m1 £m
2011 ............................................................. – – – –
2012 ............................................................. 722 465 – –
2013 ............................................................. 722 465 – –
2014 ............................................................. 722 465 – –
2015 ............................................................. 978 630 – –
2016 ............................................................. 978 630 768 495
2017 ............................................................. 978 630 978 630
2018 ............................................................. 978 630 978 630
1 The payment schedule was agreed with the Trustee in pounds sterling and the equivalent US dollar amounts are shown at the exchange
rate effective as at 31 December 2010.
HSBC considers that the contributions set out above, together with investment returns at an expected level of
240 basis points above the LIBOR swap curve, would be sufficient to meet the deficit as at 31 December 2008 over
the agreed period. At each subsequent actuarial valuation, HSBC has agreed with the Trustee that any shortfall in