HSBC 2010 Annual Report Download - page 182
Download and view the complete annual report
Please find page 182 of the 2010 HSBC annual report below. You can navigate through the pages in the report by either clicking on the pages listed below, or by using the keyword search tool below to find specific information within the annual report.-
 1
1 -
2
-
3
-
4
-
5
-
6
-
7
-
8
-
9
-
10
-
11
-
12
-
13
-
14
-
15
-
16
-
17
-
18
-
19
-
20
-
21
-
22
-
23
-
24
-
25
-
26
-
27
-
28
-
29
-
30
-
31
-
32
-
33
-
34
-
35
-
36
-
37
-
38
-
39
-
40
-
41
-
42
-
43
-
44
-
45
-
46
-
47
-
48
-
49
-
50
-
51
-
52
-
53
-
54
-
55
-
56
-
57
-
58
-
59
-
60
-
61
-
62
-
63
-
64
-
65
-
66
-
67
-
68
-
69
-
70
-
71
-
72
-
73
-
74
-
75
-
76
-
77
-
78
-
79
-
80
-
81
-
82
-
83
-
84
-
85
-
86
-
87
-
88
-
89
-
90
-
91
-
92
-
93
-
94
-
95
-
96
-
97
-
98
-
99
-
100
-
101
-
102
-
103
-
104
-
105
-
106
-
107
-
108
-
109
-
110
-
111
-
112
-
113
-
114
-
115
-
116
-
117
-
118
-
119
-
120
-
121
-
122
-
123
-
124
-
125
-
126
-
127
-
128
-
129
-
130
-
131
-
132
-
133
-
134
-
135
-
136
-
137
-
138
-
139
-
140
-
141
-
142
-
143
-
144
-
145
-
146
-
147
-
148
-
149
-
150
-
151
-
152
-
153
-
154
-
155
-
156
-
157
-
158
-
159
-
160
-
161
-
162
-
163
-
164
-
165
-
166
-
167
-
168
-
169
-
170
-
171
-
 172
172 -
 173
173 -
 174
174 -
 175
175 -
 176
176 -
 177
177 -
 178
178 -
 179
179 -
 180
180 -
 181
181 -
 182
182 -
 183
183 -
 184
184 -
 185
185 -
 186
186 -
 187
187 -
 188
188 -
 189
189 -
 190
190 -
 191
191 -
 192
192 -
193
-
194
-
195
-
196
-
197
-
198
-
199
-
200
-
201
-
202
-
203
-
204
-
205
-
206
-
207
-
208
-
209
-
210
-
211
-
212
-
213
-
214
-
215
-
216
-
217
-
218
-
219
-
220
-
221
-
222
-
223
-
224
-
225
-
226
-
227
-
228
-
229
-
230
-
231
-
232
-
233
-
234
-
235
-
236
-
237
-
238
-
239
-
240
-
241
-
242
-
243
-
244
-
245
-
246
-
247
-
248
-
249
-
250
-
251
-
252
-
253
-
254
-
255
-
256
-
257
-
258
-
259
-
260
-
261
-
262
-
263
-
264
-
265
-
266
-
267
-
268
-
269
-
270
-
271
-
272
-
273
-
274
-
275
-
276
-
277
-
278
-
279
-
280
-
281
-
282
-
283
-
284
-
285
-
286
-
287
-
288
-
289
-
290
-
291
-
292
-
293
-
294
-
295
-
296
-
297
-
298
-
299
-
300
-
301
-
302
-
303
-
304
-
305
-
306
-
307
-
308
-
309
-
310
-
311
-
312
-
313
-
314
-
315
-
316
-
317
-
318
-
319
-
320
-
321
-
322
-
323
-
324
-
325
-
326
-
327
-
328
-
329
-
330
-
331
-
332
-
333
-
334
-
335
-
336
-
337
-
338
-
339
-
340
-
341
-
342
-
343
-
344
-
345
-
346
-
347
-
348
-
349
-
350
-
351
-
352
-
353
-
354
-
355
-
356
-
357
-
358
-
359
-
360
-
361
-
362
-
363
-
364
-
365
-
366
-
367
-
368
-
369
-
370
-
371
-
372
-
373
-
374
-
375
-
376
-
377
-
378
-
379
-
380
-
381
-
382
-
383
-
384
-
385
-
386
-
387
-
388
-
389
-
390
-
391
-
392
-
393
-
394
-
395
-
396
 |
 |

HSBC HOLDINGS PLC
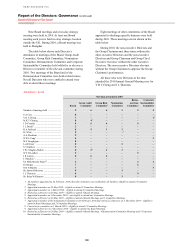
Report of the Directors: Operating and Financial Review (continued)
Capital > Capital measurement and allocation / Future developments
180
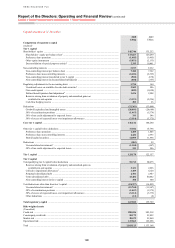
Capital structure at 31 December
2010 2009
US$m US$m
Composition of regulatory capital
(Audited)
Tier 1 capital
Shareholders’ equity ................................................................................................................................. 142,746 135,252
Shareholders’ equity per balance sheet1 ............................................................................................... 147,667 128,299
Preference share premium .................................................................................................................... (1,405) (1,405)
Other equity instruments ...................................................................................................................... (5,851) (2,133)
Deconsolidation of special purpose entities2 ....................................................................................... 2,335 10,491
Non-controlling interests .......................................................................................................................... 3,917 3,932
Non-controlling interest per balance sheet .......................................................................................... 7,248 7,362
Preference share non-controlling interests ........................................................................................... (2,426) (2,395)
Non-controlling interest transferred to tier 2 capital ........................................................................... (501) (678)
Non-controlling interest in deconsolidated subsidiaries ...................................................................... (404) (357)
Regulatory adjustments to the accounting basis ...................................................................................... 1,794 164
Unrealised losses on available-for-sale debt securities3 ...................................................................... 3,843 906
Own credit spread ................................................................................................................................. (889) (1,050)
Defined benefit pension fund adjustment4 ........................................................................................... 1,676 2,508
Reserves arising from revaluation of property and unrealised gains on
available-for-sale equities ..................................................................................................................... (3,121) (2,226)
Cash flow hedging reserve ................................................................................................................... 285 26
Deductions ................................................................................................................................................ (32,341) (33,088)
Goodwill capitalised and intangible assets .......................................................................................... (28,001) (28,680)
50% of securitisation positions ............................................................................................................ (1,467) (1,579)
50% of tax credit adjustment for expected losses ................................................................................ 241 546
50% of excess of expected losses over impairment allowances .......................................................... (3,114) (3,375)
Core tier 1 capital ................................................................................................................................... 116,116 106,260
Other tier 1 capital before deductions ...................................................................................................... 17,926 15,798
Preference share premium .................................................................................................................... 1,405 1,405
Preference share non-controlling interests ........................................................................................... 2,426 2,395
Hybrid capital securities ....................................................................................................................... 14,095 11,998
Deductions ................................................................................................................................................ (863) 99
Unconsolidated investments5 ............................................................................................................... (1,104) (447)
50% of tax credit adjustment for expected losses ................................................................................ 241 546
Tier 1 capital ........................................................................................................................................... 133,179 122,157
Tier 2 capital
Total qualifying tier 2 capital before deductions ..................................................................................... 52,713 50,075
Reserves arising from revaluation of property and unrealised gains on
available-for-sale equities ..................................................................................................................... 3,121 2,226
Collective impairment allowances6 ...................................................................................................... 3,109 4,120
Perpetual subordinated debt ................................................................................................................. 2,781 2,987
Term subordinated debt ........................................................................................................................ 43,402 40,442
Non-controlling interest in tier 2 capital .............................................................................................. 300 300
Total deductions other than from tier 1 capital ........................................................................................ (18,337) (16,503)
Unconsolidated investments5 ............................................................................................................... (13,744) (11,547)
50% of securitisation positions ............................................................................................................ (1,467) (1,579)
50% of excess of expected losses over impairment allowances .......................................................... (3,114) (3,375)
Other deductions .................................................................................................................................. (12) (2)
Total regulatory capital ......................................................................................................................... 167,555 155,729
Risk-weighted assets
(Unaudited)
Credit risk ................................................................................................................................................. 890,696 903,518
Counterparty credit risk ............................................................................................................................ 50,175 51,892
Market risk ................................................................................................................................................ 38,679 51,860
Operational risk ........................................................................................................................................ 123,563 125,898
Total .......................................................................................................................................................... 1,103,113 1,133,168