HSBC 2010 Annual Report Download - page 349
Download and view the complete annual report
Please find page 349 of the 2010 HSBC annual report below. You can navigate through the pages in the report by either clicking on the pages listed below, or by using the keyword search tool below to find specific information within the annual report.-
 1
1 -
2
-
3
-
4
-
5
-
6
-
7
-
8
-
9
-
10
-
11
-
12
-
13
-
14
-
15
-
16
-
17
-
18
-
19
-
20
-
21
-
22
-
23
-
24
-
25
-
26
-
27
-
28
-
29
-
30
-
31
-
32
-
33
-
34
-
35
-
36
-
37
-
38
-
39
-
40
-
41
-
42
-
43
-
44
-
45
-
46
-
47
-
48
-
49
-
50
-
51
-
52
-
53
-
54
-
55
-
56
-
57
-
58
-
59
-
60
-
61
-
62
-
63
-
64
-
65
-
66
-
67
-
68
-
69
-
70
-
71
-
72
-
73
-
74
-
75
-
76
-
77
-
78
-
79
-
80
-
81
-
82
-
83
-
84
-
85
-
86
-
87
-
88
-
89
-
90
-
91
-
92
-
93
-
94
-
95
-
96
-
97
-
98
-
99
-
100
-
101
-
102
-
103
-
104
-
105
-
106
-
107
-
108
-
109
-
110
-
111
-
112
-
113
-
114
-
115
-
116
-
117
-
118
-
119
-
120
-
121
-
122
-
123
-
124
-
125
-
126
-
127
-
128
-
129
-
130
-
131
-
132
-
133
-
134
-
135
-
136
-
137
-
138
-
139
-
140
-
141
-
142
-
143
-
144
-
145
-
146
-
147
-
148
-
149
-
150
-
151
-
152
-
153
-
154
-
155
-
156
-
157
-
158
-
159
-
160
-
161
-
162
-
163
-
164
-
165
-
166
-
167
-
168
-
169
-
170
-
171
-
172
-
173
-
174
-
175
-
176
-
177
-
178
-
179
-
180
-
181
-
182
-
183
-
184
-
185
-
186
-
187
-
188
-
189
-
190
-
191
-
192
-
193
-
194
-
195
-
196
-
197
-
198
-
199
-
200
-
201
-
202
-
203
-
204
-
205
-
206
-
207
-
208
-
209
-
210
-
211
-
212
-
213
-
214
-
215
-
216
-
217
-
218
-
219
-
220
-
221
-
222
-
223
-
224
-
225
-
226
-
227
-
228
-
229
-
230
-
231
-
232
-
233
-
234
-
235
-
236
-
237
-
238
-
239
-
240
-
241
-
242
-
243
-
244
-
245
-
246
-
247
-
248
-
249
-
250
-
251
-
252
-
253
-
254
-
255
-
256
-
257
-
258
-
259
-
260
-
261
-
262
-
263
-
264
-
265
-
266
-
267
-
268
-
269
-
270
-
271
-
272
-
273
-
274
-
275
-
276
-
277
-
278
-
279
-
280
-
281
-
282
-
283
-
284
-
285
-
286
-
287
-
288
-
289
-
290
-
291
-
292
-
293
-
294
-
295
-
296
-
297
-
298
-
299
-
300
-
301
-
302
-
303
-
304
-
305
-
306
-
307
-
308
-
309
-
310
-
311
-
312
-
313
-
314
-
315
-
316
-
317
-
318
-
319
-
320
-
321
-
322
-
323
-
324
-
325
-
326
-
327
-
328
-
329
-
330
-
331
-
332
-
333
-
334
-
335
-
336
-
337
-
338
-
 339
339 -
 340
340 -
 341
341 -
 342
342 -
 343
343 -
 344
344 -
 345
345 -
 346
346 -
 347
347 -
 348
348 -
 349
349 -
 350
350 -
 351
351 -
 352
352 -
 353
353 -
 354
354 -
 355
355 -
 356
356 -
 357
357 -
 358
358 -
 359
359 -
360
-
361
-
362
-
363
-
364
-
365
-
366
-
367
-
368
-
369
-
370
-
371
-
372
-
373
-
374
-
375
-
376
-
377
-
378
-
379
-
380
-
381
-
382
-
383
-
384
-
385
-
386
-
387
-
388
-
389
-
390
-
391
-
392
-
393
-
394
-
395
-
396
 |
 |

347
Overview Operating & Financial Review Governance Financial Statements Shareholder Information
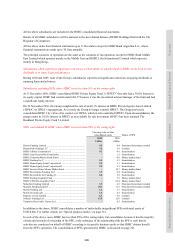
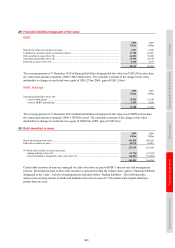
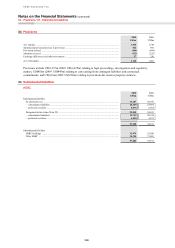
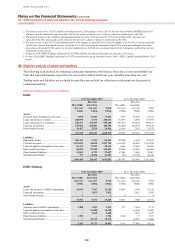
HSBC’s subordinated liabilities
2010 2009
US$m US$m
Amounts owed to third parties by HSBC Holdings (see page 349) ................................................... 22,878 23,048
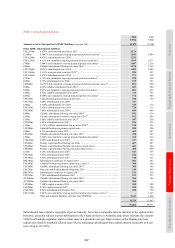
Other HSBC subordinated liabilities
US$2,939m 6.676% senior subordinated notes 20211 ..................................................................... 2,174 –
€1,400m 5.3687% non-cumulative step-up perpetual preferred securities2 ............................... 1,843 1,804
US$1,250m 4.875% subordinated notes 2020 ................................................................................. 1,252 –
US$1,250m 4.61% non-cumulative step-up perpetual preferred securities2 ................................... 1,185 1,077
£700m 5.844% non-cumulative step-up perpetual preferred securities3 ................................. 1,087 1,136
€800m Callable subordinated floating rate notes 20164 .......................................................... 1,070 1,152
US$1,000m 4.625% subordinated notes 2014 ................................................................................. 1,009 1,002
US$1,000m 5.911% trust preferred securities 20355 ....................................................................... 994 993
US$1,000m 5.875% subordinated notes 2034 ................................................................................. 971 950
€750m 5.13% non-cumulative step-up perpetual preferred securities2 ................................... 958 960
£600m 4.75% subordinated notes 2046 ................................................................................... 919 961
US$900m 10.176% non-cumulative step-up perpetual preferred securities, series 22 ................. 891 890
€600m 4.25% callable subordinated notes 20164 .................................................................... 823 904
€600m 8.03% non-cumulative step-up perpetual preferred securities2 ................................... 801 862
£500m 4.75% callable subordinated notes 20206 .................................................................... 774 785
£500m 8.208% non-cumulative step-up perpetual preferred securities2 ................................. 772 806
US$750m Undated floating rate primary capital notes ................................................................. 750 750
US$750m 5.00% subordinated notes 2020 ................................................................................... 747 –
£500m 5.375% subordinated notes 2033 ................................................................................. 729 776
US$750m 5.625% subordinated notes 2035 ................................................................................. 728 712
US$700m 7.00% subordinated notes 2039 ................................................................................... 694 688
€500m Callable subordinated floating rate notes 20207 .......................................................... 592 639
£350m Callable subordinated variable coupon notes 20178..................................................... 562 608
£350m 5.00% callable subordinated notes 20239 .................................................................... 547 550
US$500m 6.00% subordinated notes 2017 ................................................................................... 526 521
£350m 5.375% callable subordinated step-up notes 203010 .................................................... 510 531
US$500m Undated floating rate primary capital notes ................................................................. 500 500
£300m 6.5% subordinated notes 2023 ..................................................................................... 462 483
US$450m Callable subordinated floating rate notes 201611 ......................................................... 450 449
£300m 5.862% non-cumulative step-up perpetual preferred securities3 ................................. 434 412
CAD400m 4.80% subordinated notes 2022 ................................................................................... 417 382
US$400m Primary capital undated floating rate notes ................................................................. 407 407
US$400m Primary capital undated floating rate notes (second series) ........................................ 403 404
US$400m Primary capital undated floating rate notes (third series) ............................................ 400 400
£225m 6.25% subordinated notes 2041 ................................................................................... 347 363
US$300m 7.65% subordinated notes 2025 ................................................................................... 342 312
US$300m 6.95% subordinated notes 2011 ................................................................................... 310 321
BRL500m Subordinated certificates of deposit 2016 ................................................................... 301 287
US$300m Undated floating rate primary capital notes, series 3 .................................................. 300 300
US$300m Callable subordinated floating rate notes 201712 ......................................................... 300 299
US$250m Non-convertible subordinated obligations 2019 .......................................................... 248 247
BRL383m Subordinated certificates of deposit 2015 ................................................................... 231 220
US$250m 7.20% subordinated debentures 2097 .......................................................................... 213 213
AUD200m Callable subordinated floating rate notes 201613 ......................................................... 204 180
AUD200m Callable subordinated floating rate notes 2020 ........................................................... 204 –
US$200m 7.808% capital securities 2026 .................................................................................... 200 200
US$200m 8.38% capital securities 2027 ...................................................................................... 200 200
CAD200m 4.94% subordinated debentures 2021 .......................................................................... 200 190
US$1,350m 9.547% non-cumulative step-up perpetual preferred securities, series 114 .................. – 1,349
Other subordinated liabilities each less than US$200m .............................................. 3,343 3,688
34,324 31,863
57,202 54,911
Subordinated loan capital is repayable at par on maturity, but some is repayable prior to maturity at the option of the
borrower, generally subject to prior notification to the Financial Services Authority and, where relevant, the consent
of the local banking regulator, and in certain cases at a premium over par. Interest rates on the floating rate loan
capital are related to interbank offered rates. On the remaining subordinated loan capital, interest is payable at fixed
rates of up to 10.176%.