HSBC 2010 Annual Report Download - page 274
Download and view the complete annual report
Please find page 274 of the 2010 HSBC annual report below. You can navigate through the pages in the report by either clicking on the pages listed below, or by using the keyword search tool below to find specific information within the annual report.-
 1
1 -
2
-
3
-
4
-
5
-
6
-
7
-
8
-
9
-
10
-
11
-
12
-
13
-
14
-
15
-
16
-
17
-
18
-
19
-
20
-
21
-
22
-
23
-
24
-
25
-
26
-
27
-
28
-
29
-
30
-
31
-
32
-
33
-
34
-
35
-
36
-
37
-
38
-
39
-
40
-
41
-
42
-
43
-
44
-
45
-
46
-
47
-
48
-
49
-
50
-
51
-
52
-
53
-
54
-
55
-
56
-
57
-
58
-
59
-
60
-
61
-
62
-
63
-
64
-
65
-
66
-
67
-
68
-
69
-
70
-
71
-
72
-
73
-
74
-
75
-
76
-
77
-
78
-
79
-
80
-
81
-
82
-
83
-
84
-
85
-
86
-
87
-
88
-
89
-
90
-
91
-
92
-
93
-
94
-
95
-
96
-
97
-
98
-
99
-
100
-
101
-
102
-
103
-
104
-
105
-
106
-
107
-
108
-
109
-
110
-
111
-
112
-
113
-
114
-
115
-
116
-
117
-
118
-
119
-
120
-
121
-
122
-
123
-
124
-
125
-
126
-
127
-
128
-
129
-
130
-
131
-
132
-
133
-
134
-
135
-
136
-
137
-
138
-
139
-
140
-
141
-
142
-
143
-
144
-
145
-
146
-
147
-
148
-
149
-
150
-
151
-
152
-
153
-
154
-
155
-
156
-
157
-
158
-
159
-
160
-
161
-
162
-
163
-
164
-
165
-
166
-
167
-
168
-
169
-
170
-
171
-
172
-
173
-
174
-
175
-
176
-
177
-
178
-
179
-
180
-
181
-
182
-
183
-
184
-
185
-
186
-
187
-
188
-
189
-
190
-
191
-
192
-
193
-
194
-
195
-
196
-
197
-
198
-
199
-
200
-
201
-
202
-
203
-
204
-
205
-
206
-
207
-
208
-
209
-
210
-
211
-
212
-
213
-
214
-
215
-
216
-
217
-
218
-
219
-
220
-
221
-
222
-
223
-
224
-
225
-
226
-
227
-
228
-
229
-
230
-
231
-
232
-
233
-
234
-
235
-
236
-
237
-
238
-
239
-
240
-
241
-
242
-
243
-
244
-
245
-
246
-
247
-
248
-
249
-
250
-
251
-
252
-
253
-
254
-
255
-
256
-
257
-
258
-
259
-
260
-
261
-
262
-
263
-
 264
264 -
 265
265 -
 266
266 -
 267
267 -
 268
268 -
 269
269 -
 270
270 -
 271
271 -
 272
272 -
 273
273 -
 274
274 -
 275
275 -
 276
276 -
 277
277 -
 278
278 -
 279
279 -
 280
280 -
 281
281 -
 282
282 -
 283
283 -
 284
284 -
285
-
286
-
287
-
288
-
289
-
290
-
291
-
292
-
293
-
294
-
295
-
296
-
297
-
298
-
299
-
300
-
301
-
302
-
303
-
304
-
305
-
306
-
307
-
308
-
309
-
310
-
311
-
312
-
313
-
314
-
315
-
316
-
317
-
318
-
319
-
320
-
321
-
322
-
323
-
324
-
325
-
326
-
327
-
328
-
329
-
330
-
331
-
332
-
333
-
334
-
335
-
336
-
337
-
338
-
339
-
340
-
341
-
342
-
343
-
344
-
345
-
346
-
347
-
348
-
349
-
350
-
351
-
352
-
353
-
354
-
355
-
356
-
357
-
358
-
359
-
360
-
361
-
362
-
363
-
364
-
365
-
366
-
367
-
368
-
369
-
370
-
371
-
372
-
373
-
374
-
375
-
376
-
377
-
378
-
379
-
380
-
381
-
382
-
383
-
384
-
385
-
386
-
387
-
388
-
389
-
390
-
391
-
392
-
393
-
394
-
395
-
396
 |
 |
HSBC HOLDINGS PLC
Notes on the Financial Statements (continued)
4 – Net earned insurance premiums / 5 – Net insurance claims incurred / 6 – Net operating income
272
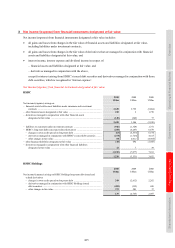
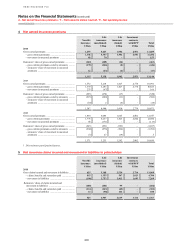
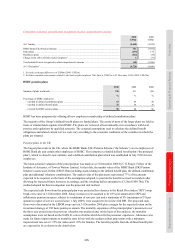
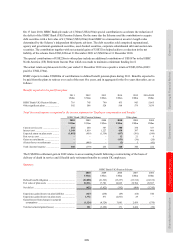
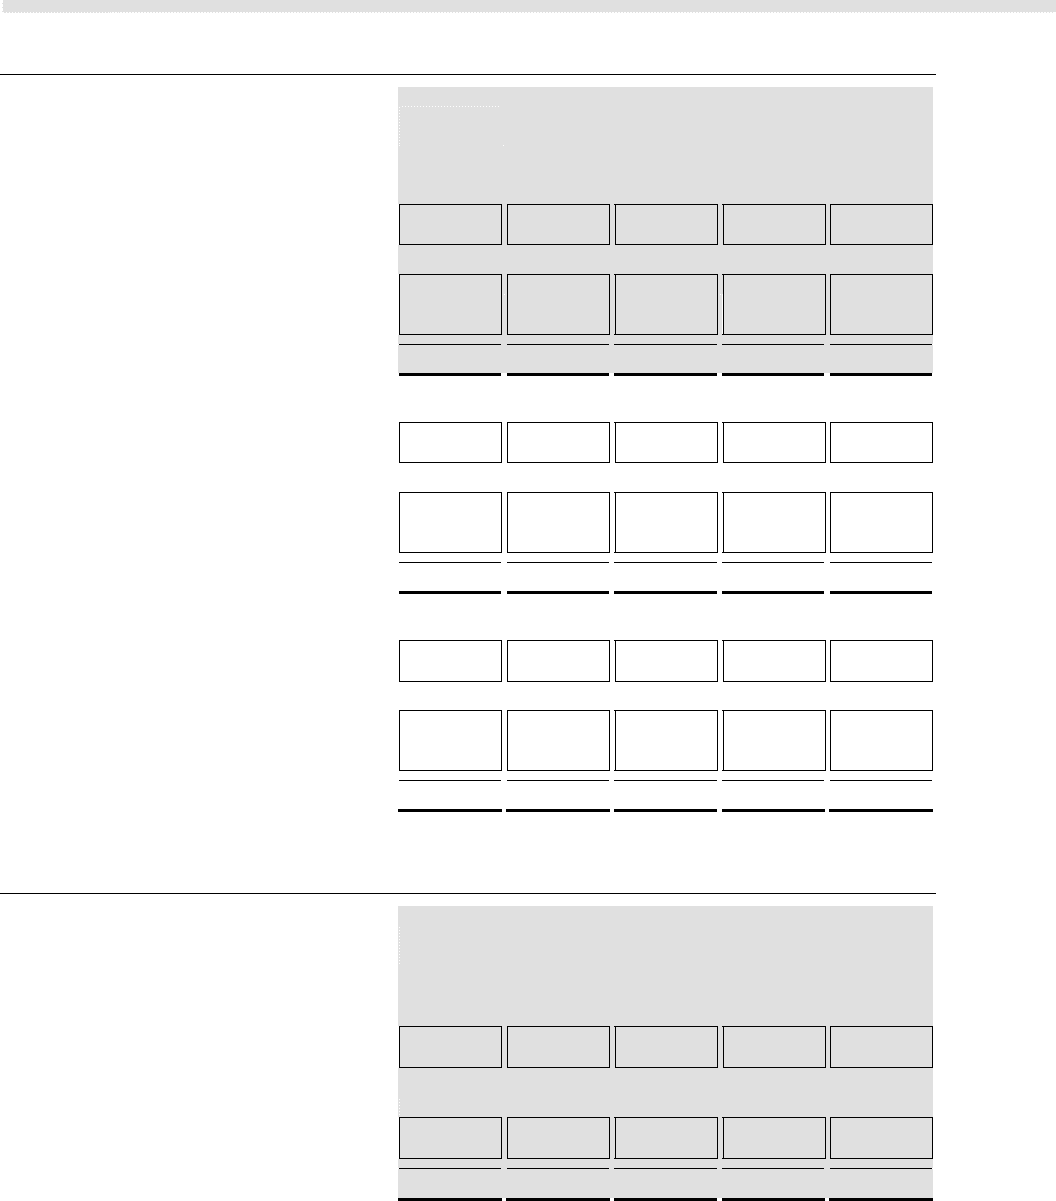
4 Net earned insurance premiums
Non-life
insurance
Life
insurance
(non-linked)
Life
insurance
(linked)
Investment
contracts
with DPF1 Total
US$m US$m US$m US$m US$m
2010
Gross earned premiums ................................................ 1,275 5,427 1,956 2,951 11,609
– gross written premiums ......................................... 1,192 5,357 1,956 2,951 11,456
– movement in unearned premiums ......................... 83 70 – – 153
Reinsurers’ share of gross earned premiums ................ (160) (289) (14) – (463)
– gross written premiums ceded to reinsurers .......... (172) (266) (8) – (446)
– reinsurers’ share of movement in unearned
premiums ............................................................... 12 (23) (6) – (17)
1,115 5,138 1,942 2,951 11,146
2009
Gross earned premiums ................................................ 1,572 5,218 1,427 2,774 10,991
– gross written premiums ......................................... 1,339 5,285 1,427 2,774 10,825
– movement in unearned premiums ......................... 233 (67) – – 166
Reinsurers’ share of gross earned premiums ................ (225) (278) (17) – (520)
– gross written premiums ceded to reinsurers .......... (215) (280) (11) – (506)
– reinsurers’ share of movement in unearned
premiums ............................................................... (10) 2 (6) – (14)
1,347 4,940 1,410 2,774 10,471
2008
Gross earned premiums ................................................ 1,834 6,086 1,825 2,802 12,547
– gross written premiums ......................................... 1,776 6,257 1,825 2,802 12,660
– movement in unearned premiums ......................... 58 (171) – – (113)
Reinsurers’ share of gross earned premiums ................ (263) (851) (583) – (1,697)
– gross written premiums ceded to reinsurers .......... (260) (878) (564) – (1,702)
– reinsurers’ share of movement in unearned
premiums ............................................................... (3) 27 (19) – 5
1,571 5,235 1,242 2,802 10,850
1 Discretionary participation features.
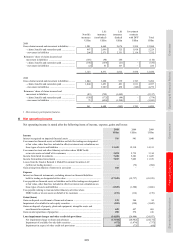
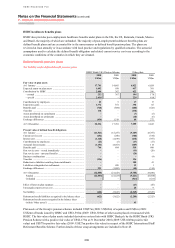
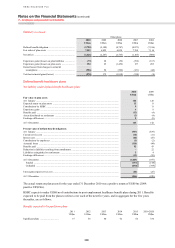
5 Net insurance claims incurred and movement in liabilities to policyholders
Non-life
insurance
Life
insurance
(non-linked)
Life
insurance
(linked)
Investment
contracts
with DPF1 Total
US$m US$m US$m US$m US$m
2010
Gross claims incurred and movement in liabilities ........... 625 5,108 2,520 3,716 11,969
– claims, benefits and surrenders paid ..................... 815 1,355 507 2,023 4,700
– movement in liabilities .......................................... (190) 3,753 2,013 1,693 7,269
Reinsurers’ share of claims incurred and
movement in liabilities ............................................ (100) (201) 99 – (202)
– claims, benefits and surrenders paid ..................... (114) (143) (45) – (302)
– movement in liabilities .......................................... 14 (58) 144 – 100
525 4,907 2,619 3,716 11,767