HSBC 2010 Annual Report Download - page 317
Download and view the complete annual report
Please find page 317 of the 2010 HSBC annual report below. You can navigate through the pages in the report by either clicking on the pages listed below, or by using the keyword search tool below to find specific information within the annual report.-
 1
1 -
2
-
3
-
4
-
5
-
6
-
7
-
8
-
9
-
10
-
11
-
12
-
13
-
14
-
15
-
16
-
17
-
18
-
19
-
20
-
21
-
22
-
23
-
24
-
25
-
26
-
27
-
28
-
29
-
30
-
31
-
32
-
33
-
34
-
35
-
36
-
37
-
38
-
39
-
40
-
41
-
42
-
43
-
44
-
45
-
46
-
47
-
48
-
49
-
50
-
51
-
52
-
53
-
54
-
55
-
56
-
57
-
58
-
59
-
60
-
61
-
62
-
63
-
64
-
65
-
66
-
67
-
68
-
69
-
70
-
71
-
72
-
73
-
74
-
75
-
76
-
77
-
78
-
79
-
80
-
81
-
82
-
83
-
84
-
85
-
86
-
87
-
88
-
89
-
90
-
91
-
92
-
93
-
94
-
95
-
96
-
97
-
98
-
99
-
100
-
101
-
102
-
103
-
104
-
105
-
106
-
107
-
108
-
109
-
110
-
111
-
112
-
113
-
114
-
115
-
116
-
117
-
118
-
119
-
120
-
121
-
122
-
123
-
124
-
125
-
126
-
127
-
128
-
129
-
130
-
131
-
132
-
133
-
134
-
135
-
136
-
137
-
138
-
139
-
140
-
141
-
142
-
143
-
144
-
145
-
146
-
147
-
148
-
149
-
150
-
151
-
152
-
153
-
154
-
155
-
156
-
157
-
158
-
159
-
160
-
161
-
162
-
163
-
164
-
165
-
166
-
167
-
168
-
169
-
170
-
171
-
172
-
173
-
174
-
175
-
176
-
177
-
178
-
179
-
180
-
181
-
182
-
183
-
184
-
185
-
186
-
187
-
188
-
189
-
190
-
191
-
192
-
193
-
194
-
195
-
196
-
197
-
198
-
199
-
200
-
201
-
202
-
203
-
204
-
205
-
206
-
207
-
208
-
209
-
210
-
211
-
212
-
213
-
214
-
215
-
216
-
217
-
218
-
219
-
220
-
221
-
222
-
223
-
224
-
225
-
226
-
227
-
228
-
229
-
230
-
231
-
232
-
233
-
234
-
235
-
236
-
237
-
238
-
239
-
240
-
241
-
242
-
243
-
244
-
245
-
246
-
247
-
248
-
249
-
250
-
251
-
252
-
253
-
254
-
255
-
256
-
257
-
258
-
259
-
260
-
261
-
262
-
263
-
264
-
265
-
266
-
267
-
268
-
269
-
270
-
271
-
272
-
273
-
274
-
275
-
276
-
277
-
278
-
279
-
280
-
281
-
282
-
283
-
284
-
285
-
286
-
287
-
288
-
289
-
290
-
291
-
292
-
293
-
294
-
295
-
296
-
297
-
298
-
299
-
300
-
301
-
302
-
303
-
304
-
305
-
306
-
 307
307 -
 308
308 -
 309
309 -
 310
310 -
 311
311 -
 312
312 -
 313
313 -
 314
314 -
 315
315 -
 316
316 -
 317
317 -
 318
318 -
 319
319 -
 320
320 -
 321
321 -
 322
322 -
 323
323 -
 324
324 -
 325
325 -
 326
326 -
 327
327 -
328
-
329
-
330
-
331
-
332
-
333
-
334
-
335
-
336
-
337
-
338
-
339
-
340
-
341
-
342
-
343
-
344
-
345
-
346
-
347
-
348
-
349
-
350
-
351
-
352
-
353
-
354
-
355
-
356
-
357
-
358
-
359
-
360
-
361
-
362
-
363
-
364
-
365
-
366
-
367
-
368
-
369
-
370
-
371
-
372
-
373
-
374
-
375
-
376
-
377
-
378
-
379
-
380
-
381
-
382
-
383
-
384
-
385
-
386
-
387
-
388
-
389
-
390
-
391
-
392
-
393
-
394
-
395
-
396
 |
 |

315
Overview Operating & Financial Review Governance Financial Statements Shareholder Information
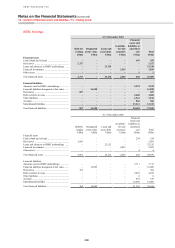
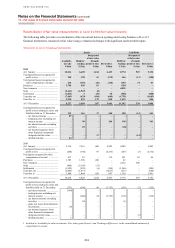
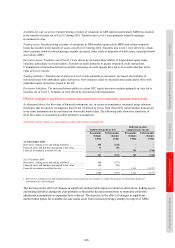
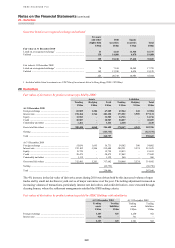
Available-for-sale securities: Greater pricing certainty of valuations in ABS markets (particularly MBS) has resulted
in the transfer of assets out of Level 3 during 2010. Transfers into Level 3 were primarily related to strategic
investments in Asia.
Trading assets: Greater pricing certainty of valuations in ABS markets (particularly MBS) and certain corporate
bonds has resulted in the transfer of assets out of Level 3 during 2010. Transfers into Level 3 were driven by certain
other corporate bonds for which pricing certainty decreased. Sales relate to disposals of whole loans, municipal bonds
and various ABSs.
Derivative assets: Transfers out of Level 3 were driven by increased observability of longer-dated equity index
volatility, particularly in Asian markets. Transfers in relate primarily to quanto structured credit transactions.
Commutations of monoline derivatives and the narrowing of credit spreads have led to an overall reduction in the
value of Level 3 assets.
Trading liabilities: Transfers out of and in to Level 3 relate primarily to increased / decreased observability of
structured notes with embedded equity derivatives. New issuances relate to structured notes particularly those with
embedded equity derivatives issued in the US.
Derivative liabilities: The increased observability in certain OTC equity derivative markets primarily in Asia led to
transfers out of Level 3. Transfers in were driven by structured credit transactions.
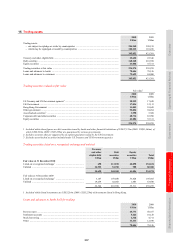
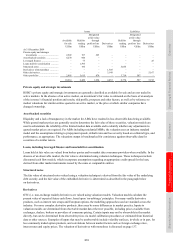
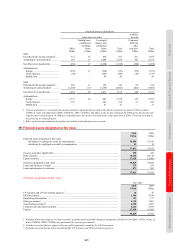
Effect of changes in significant unobservable assumptions to reasonably possible alternatives
As discussed above, the fair value of financial instruments are, in certain circumstances, measured using valuation
techniques that incorporate assumptions that are not evidenced by prices from observable current market transactions
in the same instrument and are not based on observable market data. The following table shows the sensitivity of
these fair values to reasonably possible alternative assumptions:
Sensitivity of fair values to reasonably possible alternative assumptions
Reflected in profit or loss
Reflected in other
comprehensive income
Favourable
changes
Unfavourable
changes
Favourable
changes
Unfavourable
changes
US$m US$m US$m US$m
At 31 December 2010
Derivatives, trading assets and trading liabilities1 ........................ 554 (444) – –
Financial assets and liabilities designated at fair value ................ 77 (75) – –
Financial investments: available for sale ..................................... – – 763 (744)
631 (519) 763 (744)
At 31 December 2009
Derivatives, trading assets and trading liabilities1 ........................ 984 (577) – –
Financial assets and liabilities designated at fair value ................ 102 (98) – –
Financial investments: available for sale ..................................... – – 1,161 (1,157)
1,086 (675) 1,161 (1,157)
1 Derivatives, trading assets and trading liabilities are presented as one category to reflect the manner in which these financial
instruments are risk-managed.
The decrease in the effect of changes in significant unobservable inputs in relation to derivatives, trading assets
and trading liabilities during the year primarily reflected the decreased sensitivity to monoline credit risk
adjustment assumptions as exposures have reduced. The decrease in the effect of changes in significant
unobservable inputs for available-for-sale assets arose from increased pricing certainty in respect of ABSs.