HSBC 2010 Annual Report Download - page 309
Download and view the complete annual report
Please find page 309 of the 2010 HSBC annual report below. You can navigate through the pages in the report by either clicking on the pages listed below, or by using the keyword search tool below to find specific information within the annual report.-
 1
1 -
2
-
3
-
4
-
5
-
6
-
7
-
8
-
9
-
10
-
11
-
12
-
13
-
14
-
15
-
16
-
17
-
18
-
19
-
20
-
21
-
22
-
23
-
24
-
25
-
26
-
27
-
28
-
29
-
30
-
31
-
32
-
33
-
34
-
35
-
36
-
37
-
38
-
39
-
40
-
41
-
42
-
43
-
44
-
45
-
46
-
47
-
48
-
49
-
50
-
51
-
52
-
53
-
54
-
55
-
56
-
57
-
58
-
59
-
60
-
61
-
62
-
63
-
64
-
65
-
66
-
67
-
68
-
69
-
70
-
71
-
72
-
73
-
74
-
75
-
76
-
77
-
78
-
79
-
80
-
81
-
82
-
83
-
84
-
85
-
86
-
87
-
88
-
89
-
90
-
91
-
92
-
93
-
94
-
95
-
96
-
97
-
98
-
99
-
100
-
101
-
102
-
103
-
104
-
105
-
106
-
107
-
108
-
109
-
110
-
111
-
112
-
113
-
114
-
115
-
116
-
117
-
118
-
119
-
120
-
121
-
122
-
123
-
124
-
125
-
126
-
127
-
128
-
129
-
130
-
131
-
132
-
133
-
134
-
135
-
136
-
137
-
138
-
139
-
140
-
141
-
142
-
143
-
144
-
145
-
146
-
147
-
148
-
149
-
150
-
151
-
152
-
153
-
154
-
155
-
156
-
157
-
158
-
159
-
160
-
161
-
162
-
163
-
164
-
165
-
166
-
167
-
168
-
169
-
170
-
171
-
172
-
173
-
174
-
175
-
176
-
177
-
178
-
179
-
180
-
181
-
182
-
183
-
184
-
185
-
186
-
187
-
188
-
189
-
190
-
191
-
192
-
193
-
194
-
195
-
196
-
197
-
198
-
199
-
200
-
201
-
202
-
203
-
204
-
205
-
206
-
207
-
208
-
209
-
210
-
211
-
212
-
213
-
214
-
215
-
216
-
217
-
218
-
219
-
220
-
221
-
222
-
223
-
224
-
225
-
226
-
227
-
228
-
229
-
230
-
231
-
232
-
233
-
234
-
235
-
236
-
237
-
238
-
239
-
240
-
241
-
242
-
243
-
244
-
245
-
246
-
247
-
248
-
249
-
250
-
251
-
252
-
253
-
254
-
255
-
256
-
257
-
258
-
259
-
260
-
261
-
262
-
263
-
264
-
265
-
266
-
267
-
268
-
269
-
270
-
271
-
272
-
273
-
274
-
275
-
276
-
277
-
278
-
279
-
280
-
281
-
282
-
283
-
284
-
285
-
286
-
287
-
288
-
289
-
290
-
291
-
292
-
293
-
294
-
295
-
296
-
297
-
298
-
 299
299 -
 300
300 -
 301
301 -
 302
302 -
 303
303 -
 304
304 -
 305
305 -
 306
306 -
 307
307 -
 308
308 -
 309
309 -
 310
310 -
 311
311 -
 312
312 -
 313
313 -
 314
314 -
 315
315 -
 316
316 -
 317
317 -
 318
318 -
 319
319 -
320
-
321
-
322
-
323
-
324
-
325
-
326
-
327
-
328
-
329
-
330
-
331
-
332
-
333
-
334
-
335
-
336
-
337
-
338
-
339
-
340
-
341
-
342
-
343
-
344
-
345
-
346
-
347
-
348
-
349
-
350
-
351
-
352
-
353
-
354
-
355
-
356
-
357
-
358
-
359
-
360
-
361
-
362
-
363
-
364
-
365
-
366
-
367
-
368
-
369
-
370
-
371
-
372
-
373
-
374
-
375
-
376
-
377
-
378
-
379
-
380
-
381
-
382
-
383
-
384
-
385
-
386
-
387
-
388
-
389
-
390
-
391
-
392
-
393
-
394
-
395
-
396
 |
 |
307
Overview Operating & Financial Review Governance Financial Statements Shareholder Information
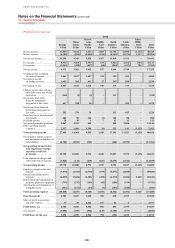
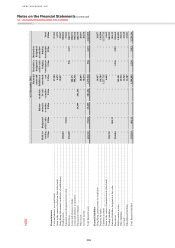
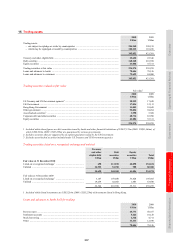
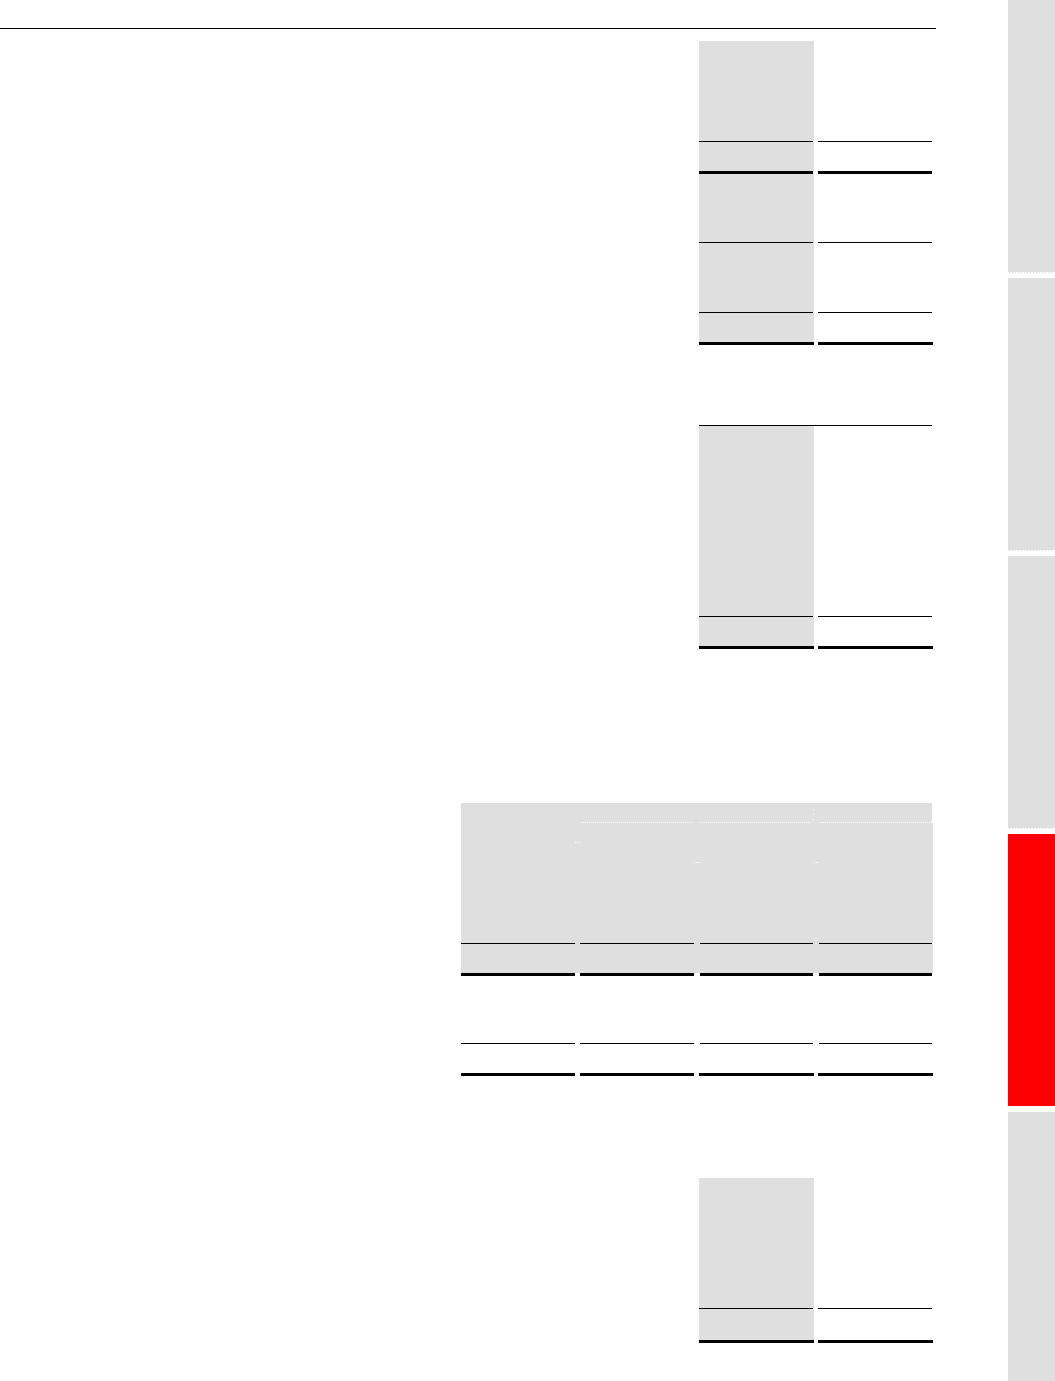
15 Trading assets
2010 2009
US$m US$m
Trading assets:
– not subject to repledge or resale by counterparties .......................................................................... 284,940 320,155
– which may be repledged or resold by counterparties ...................................................................... 100,112 101,226
385,052 421,381
Treasury and other eligible bills ............................................................................................................... 25,620 22,346
Debt securities .......................................................................................................................................... 168,268 201,598
Equity securities ....................................................................................................................................... 41,086 35,311
Trading securities at fair value ................................................................................................................. 234,974 259,255
Loans and advances to banks ................................................................................................................... 70,456 78,126
Loans and advances to customers ............................................................................................................ 79,622 84,000
385,052 421,381
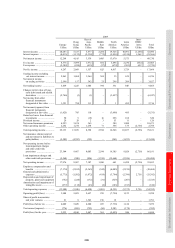
Trading securities valued at fair value
Fair value1
2010 2009
US$m US$m
US Treasury and US Government agencies2 ............................................................................................ 20,239 17,620
UK Government ........................................................................................................................................ 17,036 12,113
Hong Kong Government .......................................................................................................................... 11,053 10,649
Other government ..................................................................................................................................... 92,826 94,264
Asset-backed securities3 ........................................................................................................................... 3,998 5,308
Corporate debt and other securities .......................................................................................................... 48,736 83,990
Equity securities ....................................................................................................................................... 41,086 35,311
234,974 259,255
1 Included within these figures are debt securities issued by banks and other financial institutions of US$37,170m (2009: US$41,466m), of
which US$8,330m (2009: US$7,280m) are guaranteed by various governments.
2 Includes securities that are supported by an explicit guarantee issued by the US Government.
3 Excludes asset-backed securities included under US Treasury and US Government agencies.
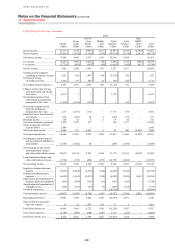
Trading securities listed on a recognised exchange and unlisted
Treasury
and other
eligible bills
Debt
securities
Equity
securities
Total
US$m US$m US$m US$m
Fair value at 31 December 2010
Listed on a recognised exchange1 ................................................ 698 113,878 40,098 154,674
Unlisted ......................................................................................... 24,922 54,390 988 80,300
25,620 168,268 41,086 234,974
Fair value at 31 December 2009
Listed on a recognised exchange1 ................................................ 3,107 159,030 33,428 195,565
Unlisted ......................................................................................... 19,239 42,568 1,883 63,690
22,346 201,598 35,311 259,255
1 Included within listed investments are US$3,254m (2009: US$3,229m) of investments listed in Hong Kong.
Loans and advances to banks held for trading
2010 2009
US$m US$m
Reverse repos ............................................................................................................................................ 45,771 50,357
Settlement accounts .................................................................................................................................. 5,226 10,128
Stock borrowing ....................................................................................................................................... 6,346 4,711
Other ......................................................................................................................................................... 13,113 12,930
70,456 78,126