HSBC 2010 Annual Report Download - page 315
Download and view the complete annual report
Please find page 315 of the 2010 HSBC annual report below. You can navigate through the pages in the report by either clicking on the pages listed below, or by using the keyword search tool below to find specific information within the annual report.-
 1
1 -
2
-
3
-
4
-
5
-
6
-
7
-
8
-
9
-
10
-
11
-
12
-
13
-
14
-
15
-
16
-
17
-
18
-
19
-
20
-
21
-
22
-
23
-
24
-
25
-
26
-
27
-
28
-
29
-
30
-
31
-
32
-
33
-
34
-
35
-
36
-
37
-
38
-
39
-
40
-
41
-
42
-
43
-
44
-
45
-
46
-
47
-
48
-
49
-
50
-
51
-
52
-
53
-
54
-
55
-
56
-
57
-
58
-
59
-
60
-
61
-
62
-
63
-
64
-
65
-
66
-
67
-
68
-
69
-
70
-
71
-
72
-
73
-
74
-
75
-
76
-
77
-
78
-
79
-
80
-
81
-
82
-
83
-
84
-
85
-
86
-
87
-
88
-
89
-
90
-
91
-
92
-
93
-
94
-
95
-
96
-
97
-
98
-
99
-
100
-
101
-
102
-
103
-
104
-
105
-
106
-
107
-
108
-
109
-
110
-
111
-
112
-
113
-
114
-
115
-
116
-
117
-
118
-
119
-
120
-
121
-
122
-
123
-
124
-
125
-
126
-
127
-
128
-
129
-
130
-
131
-
132
-
133
-
134
-
135
-
136
-
137
-
138
-
139
-
140
-
141
-
142
-
143
-
144
-
145
-
146
-
147
-
148
-
149
-
150
-
151
-
152
-
153
-
154
-
155
-
156
-
157
-
158
-
159
-
160
-
161
-
162
-
163
-
164
-
165
-
166
-
167
-
168
-
169
-
170
-
171
-
172
-
173
-
174
-
175
-
176
-
177
-
178
-
179
-
180
-
181
-
182
-
183
-
184
-
185
-
186
-
187
-
188
-
189
-
190
-
191
-
192
-
193
-
194
-
195
-
196
-
197
-
198
-
199
-
200
-
201
-
202
-
203
-
204
-
205
-
206
-
207
-
208
-
209
-
210
-
211
-
212
-
213
-
214
-
215
-
216
-
217
-
218
-
219
-
220
-
221
-
222
-
223
-
224
-
225
-
226
-
227
-
228
-
229
-
230
-
231
-
232
-
233
-
234
-
235
-
236
-
237
-
238
-
239
-
240
-
241
-
242
-
243
-
244
-
245
-
246
-
247
-
248
-
249
-
250
-
251
-
252
-
253
-
254
-
255
-
256
-
257
-
258
-
259
-
260
-
261
-
262
-
263
-
264
-
265
-
266
-
267
-
268
-
269
-
270
-
271
-
272
-
273
-
274
-
275
-
276
-
277
-
278
-
279
-
280
-
281
-
282
-
283
-
284
-
285
-
286
-
287
-
288
-
289
-
290
-
291
-
292
-
293
-
294
-
295
-
296
-
297
-
298
-
299
-
300
-
301
-
302
-
303
-
304
-
 305
305 -
 306
306 -
 307
307 -
 308
308 -
 309
309 -
 310
310 -
 311
311 -
 312
312 -
 313
313 -
 314
314 -
 315
315 -
 316
316 -
 317
317 -
 318
318 -
 319
319 -
 320
320 -
 321
321 -
 322
322 -
 323
323 -
 324
324 -
 325
325 -
326
-
327
-
328
-
329
-
330
-
331
-
332
-
333
-
334
-
335
-
336
-
337
-
338
-
339
-
340
-
341
-
342
-
343
-
344
-
345
-
346
-
347
-
348
-
349
-
350
-
351
-
352
-
353
-
354
-
355
-
356
-
357
-
358
-
359
-
360
-
361
-
362
-
363
-
364
-
365
-
366
-
367
-
368
-
369
-
370
-
371
-
372
-
373
-
374
-
375
-
376
-
377
-
378
-
379
-
380
-
381
-
382
-
383
-
384
-
385
-
386
-
387
-
388
-
389
-
390
-
391
-
392
-
393
-
394
-
395
-
396
 |
 |

313
Overview Operating & Financial Review Governance Financial Statements Shareholder Information
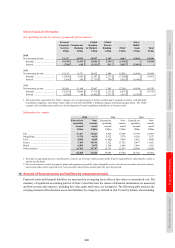
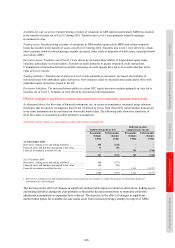
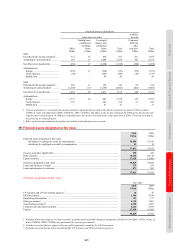
Assets Liabilities
Available
for sale
Held for
trading
Designated
at fair value
through
profit or loss Derivatives
Held for
trading
Designated
at fair value
through
profit or loss
Derivatives
US$m US$m US$m US$m US$m US$m US$m
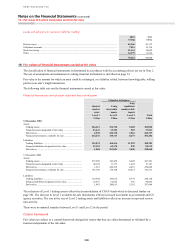
At 31 December 2009
Private equity and strategic
investments ................................... 2,949 197 345 – – – –
Asset-backed securities .................... 4,270 944 – – – – –
Leveraged finance ............................. – 73 – – – – 25
Loans held for securitisation ............ – 1,395 – – – – –
Structured notes ................................ – 196 – – 5,055 – –
Derivatives with monolines .............. – – – 1,305 – – –
Other derivatives ............................... – – – 3,148 – – 5,167
Other portfolios ................................. 2,995 3,615 879 – 3,719 507 –
10,214 6,420 1,224 4,453 8,774 507 5,192
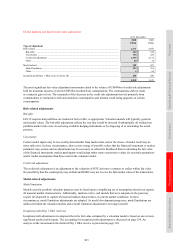
Private equity and strategic investments
HSBC’s private equity and strategic investments are generally classified as available for sale and are not traded in
active markets. In the absence of an active market, an investment’s fair value is estimated on the basis of an analysis
of the investee’s financial position and results, risk profile, prospects and other factors, as well as by reference to
market valuations for similar entities quoted in an active market, or the price at which similar companies have
changed ownership.
Asset-backed securities
Illiquidity and a lack of transparency in the market for ABSs have resulted in less observable data being available.
While quoted market prices are generally used to determine the fair value of these securities, valuation models are
used to substantiate the reliability of the limited market data available and to identify whether any adjustments to
quoted market prices are required. For ABSs including residential MBSs, the valuation uses an industry standard
model and the assumptions relating to prepayment speeds, default rates and loss severity based on collateral type, and
performance, as appropriate. The valuations output is benchmarked for consistency against observable data for
securities of a similar nature.
Loans, including leveraged finance and loans held for securitisation
Loans held at fair value are valued from broker quotes and/or market data consensus providers when available. In the
absence of an observable market, the fair value is determined using valuation techniques. These techniques include
discounted cash flow models, which incorporate assumptions regarding an appropriate credit spread for the loan,
derived from other market instruments issued by the same or comparable entities.
Structured notes
The fair value of structured notes valued using a valuation technique is derived from the fair value of the underlying
debt security, and the fair value of the embedded derivative is determined as described in the paragraph below
on derivatives.
Derivatives
OTC (i.e. non-exchange traded) derivatives are valued using valuation models. Valuation models calculate the
present value of expected future cash flows, based upon ‘no-arbitrage’ principles. For many vanilla derivative
products, such as interest rate swaps and European options, the modelling approaches used are standard across the
industry. For more complex derivative products, there may be some differences in market practice. Inputs to
valuation models are determined from observable market data wherever possible, including prices available from
exchanges, dealers, brokers or providers of consensus pricing. Certain inputs may not be observable in the market
directly, but can be determined from observable prices via model calibration procedures or estimated from historical
data or other sources. Examples of inputs that may be unobservable include volatility surfaces, in whole or in part, for
less commonly traded option products, and correlations between market factors such as foreign exchange rates,
interest rates and equity prices. The valuation of derivatives with monolines is discussed on page 137.