HSBC 2010 Annual Report Download - page 106
Download and view the complete annual report
Please find page 106 of the 2010 HSBC annual report below. You can navigate through the pages in the report by either clicking on the pages listed below, or by using the keyword search tool below to find specific information within the annual report.-
 1
1 -
2
-
3
-
4
-
5
-
6
-
7
-
8
-
9
-
10
-
11
-
12
-
13
-
14
-
15
-
16
-
17
-
18
-
19
-
20
-
21
-
22
-
23
-
24
-
25
-
26
-
27
-
28
-
29
-
30
-
31
-
32
-
33
-
34
-
35
-
36
-
37
-
38
-
39
-
40
-
41
-
42
-
43
-
44
-
45
-
46
-
47
-
48
-
49
-
50
-
51
-
52
-
53
-
54
-
55
-
56
-
57
-
58
-
59
-
60
-
61
-
62
-
63
-
64
-
65
-
66
-
67
-
68
-
69
-
70
-
71
-
72
-
73
-
74
-
75
-
76
-
77
-
78
-
79
-
80
-
81
-
82
-
83
-
84
-
85
-
86
-
87
-
88
-
89
-
90
-
91
-
92
-
93
-
94
-
95
-
 96
96 -
 97
97 -
 98
98 -
 99
99 -
 100
100 -
 101
101 -
 102
102 -
 103
103 -
 104
104 -
 105
105 -
 106
106 -
 107
107 -
 108
108 -
 109
109 -
 110
110 -
 111
111 -
 112
112 -
 113
113 -
 114
114 -
 115
115 -
 116
116 -
117
-
118
-
119
-
120
-
121
-
122
-
123
-
124
-
125
-
126
-
127
-
128
-
129
-
130
-
131
-
132
-
133
-
134
-
135
-
136
-
137
-
138
-
139
-
140
-
141
-
142
-
143
-
144
-
145
-
146
-
147
-
148
-
149
-
150
-
151
-
152
-
153
-
154
-
155
-
156
-
157
-
158
-
159
-
160
-
161
-
162
-
163
-
164
-
165
-
166
-
167
-
168
-
169
-
170
-
171
-
172
-
173
-
174
-
175
-
176
-
177
-
178
-
179
-
180
-
181
-
182
-
183
-
184
-
185
-
186
-
187
-
188
-
189
-
190
-
191
-
192
-
193
-
194
-
195
-
196
-
197
-
198
-
199
-
200
-
201
-
202
-
203
-
204
-
205
-
206
-
207
-
208
-
209
-
210
-
211
-
212
-
213
-
214
-
215
-
216
-
217
-
218
-
219
-
220
-
221
-
222
-
223
-
224
-
225
-
226
-
227
-
228
-
229
-
230
-
231
-
232
-
233
-
234
-
235
-
236
-
237
-
238
-
239
-
240
-
241
-
242
-
243
-
244
-
245
-
246
-
247
-
248
-
249
-
250
-
251
-
252
-
253
-
254
-
255
-
256
-
257
-
258
-
259
-
260
-
261
-
262
-
263
-
264
-
265
-
266
-
267
-
268
-
269
-
270
-
271
-
272
-
273
-
274
-
275
-
276
-
277
-
278
-
279
-
280
-
281
-
282
-
283
-
284
-
285
-
286
-
287
-
288
-
289
-
290
-
291
-
292
-
293
-
294
-
295
-
296
-
297
-
298
-
299
-
300
-
301
-
302
-
303
-
304
-
305
-
306
-
307
-
308
-
309
-
310
-
311
-
312
-
313
-
314
-
315
-
316
-
317
-
318
-
319
-
320
-
321
-
322
-
323
-
324
-
325
-
326
-
327
-
328
-
329
-
330
-
331
-
332
-
333
-
334
-
335
-
336
-
337
-
338
-
339
-
340
-
341
-
342
-
343
-
344
-
345
-
346
-
347
-
348
-
349
-
350
-
351
-
352
-
353
-
354
-
355
-
356
-
357
-
358
-
359
-
360
-
361
-
362
-
363
-
364
-
365
-
366
-
367
-
368
-
369
-
370
-
371
-
372
-
373
-
374
-
375
-
376
-
377
-
378
-
379
-
380
-
381
-
382
-
383
-
384
-
385
-
386
-
387
-
388
-
389
-
390
-
391
-
392
-
393
-
394
-
395
-
396
 |
 |

HSBC HOLDINGS PLC
Report of the Directors: Operating and Financial Review (continued)
Risk > Credit risk > Areas of special interest > Wholesale lending
104
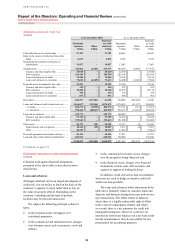
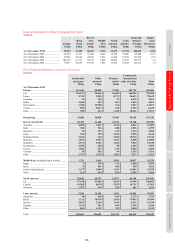
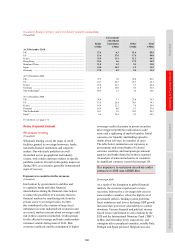
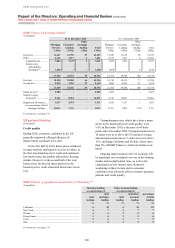
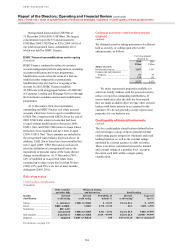
Exposures to selected eurozone countries10
(Unaudited)
At 31 December 2010
Not held for trading Held for trading
Cash and
lending to
banks11
Financial
investments
Total
balances
Net debt
securities
and loans Derivatives12
Total
balances
Total
US$bn US$bn US$bn US$bn US$bn US$bn US$bn
Belgium
Sovereign and agencies ................... 0.2 0.7 0.9 0.6 – 0.6 1.5
Banks ............................................... 5.8 0.3 6.1 1.5 1.2 2.7 8.8
6.0 1.0 7.0 2.1 1.2 3.3 10.3
Greece
Sovereign and agencies ................... – 0.3 0.3 0.8 – 0.8 1.1
Banks ............................................... – – – 0.6 – 0.6 0.6
– 0.3 0.3 1.4 – 1.4 1.7
Ireland
Sovereign and agencies ................... – 0.2 0.2 0.1 0.1 0.2 0.4
Banks ............................................... 0.2 0.5 0.7 1.1 0.4 1.5 2.2
0.2 0.7 0.9 1.2 0.5 1.7 2.6
Italy
Sovereign and agencies ................... – 1.7 1.7 1.8 – 1.8 3.5
Banks ............................................... 1.9 0.4 2.3 0.2 – 0.2 2.5
1.9 2.1 4.0 2.0 – 2.0 6.0
Portugal
Sovereign and agencies ................... – 0.1 0.1 –– – 0.1
Banks ............................................... 0.3 0.1 0.4 0.1 – 0.1 0.5
0.3 0.2 0.5 0.1 – 0.1 0.6
Spain
Sovereign and agencies ................... 0.1 0.9 1.0 0.7 0.1 0.8 1.8
Banks ............................................... 0.8 0.2 1.0 1.4 – 1.4 2.4
0.9 1.1 2.0 2.1 0.1 2.2 4.2
Total
Sovereign and agencies ................... 0.3 3.9 4.2 4.0 0.2 4.2 8.4
Banks ............................................... 9.0 1.5 10.5 4.9 1.6 6.5 17.0
9.3 5.4 14.7 8.9 1.8 10.7 25.4
For footnotes, see page 174.
under pressure, but for its specific political situation.
Rating agencies downgraded the debt of a number
of eurozone countries during 2010 and put some
on review for possible downgrades. While the
ECB continues to provide broad access to liquidity
support for eurozone sovereign borrowers and banks,
the availability of longer-term fiscal support from
the EU for sovereigns is less certain and may lead
to debt restructuring and increased private sector
participation.
The eurozone as a whole retained substantial
economic and financial strength despite the stresses
from the financial crisis. However, concerns
remained over the refinancing risks for sovereign
borrowers and banks posed by the problems with
market liquidity and the uncertainty surrounding
support arrangements in the longer term. Eurozone
policymakers have created two major facilities to
counter short-term financing problems, the European
Financial Stability Facility and the European
Financial Stability Mechanism. This has been
viewed as a positive development by the market
and rating agencies, though implementation awaits
disclosure of further details by the policymakers.
We expect the ECB and eurozone countries will
focus in 2011 on resolving intra-eurozone
imbalances, rebuilding public finances, improving
fiscal discipline, strengthening the banking system
and managing cross-border risk.
We have closely managed our exposure to
sovereign debt during 2010. At the end of the year,
our exposure to the sovereign debt of Belgium,
Greece, Ireland, Italy, Portugal and Spain was
US$8.4bn and the overall quality of the portfolio was
strong with most in-country and cross-border limits
extended to countries with high-grade internal credit
risk ratings. We regularly update our assessment of
higher risk countries and adjust our risk appetite to
reflect such changes.