HSBC 2010 Annual Report Download - page 310
Download and view the complete annual report
Please find page 310 of the 2010 HSBC annual report below. You can navigate through the pages in the report by either clicking on the pages listed below, or by using the keyword search tool below to find specific information within the annual report.-
 1
1 -
2
-
3
-
4
-
5
-
6
-
7
-
8
-
9
-
10
-
11
-
12
-
13
-
14
-
15
-
16
-
17
-
18
-
19
-
20
-
21
-
22
-
23
-
24
-
25
-
26
-
27
-
28
-
29
-
30
-
31
-
32
-
33
-
34
-
35
-
36
-
37
-
38
-
39
-
40
-
41
-
42
-
43
-
44
-
45
-
46
-
47
-
48
-
49
-
50
-
51
-
52
-
53
-
54
-
55
-
56
-
57
-
58
-
59
-
60
-
61
-
62
-
63
-
64
-
65
-
66
-
67
-
68
-
69
-
70
-
71
-
72
-
73
-
74
-
75
-
76
-
77
-
78
-
79
-
80
-
81
-
82
-
83
-
84
-
85
-
86
-
87
-
88
-
89
-
90
-
91
-
92
-
93
-
94
-
95
-
96
-
97
-
98
-
99
-
100
-
101
-
102
-
103
-
104
-
105
-
106
-
107
-
108
-
109
-
110
-
111
-
112
-
113
-
114
-
115
-
116
-
117
-
118
-
119
-
120
-
121
-
122
-
123
-
124
-
125
-
126
-
127
-
128
-
129
-
130
-
131
-
132
-
133
-
134
-
135
-
136
-
137
-
138
-
139
-
140
-
141
-
142
-
143
-
144
-
145
-
146
-
147
-
148
-
149
-
150
-
151
-
152
-
153
-
154
-
155
-
156
-
157
-
158
-
159
-
160
-
161
-
162
-
163
-
164
-
165
-
166
-
167
-
168
-
169
-
170
-
171
-
172
-
173
-
174
-
175
-
176
-
177
-
178
-
179
-
180
-
181
-
182
-
183
-
184
-
185
-
186
-
187
-
188
-
189
-
190
-
191
-
192
-
193
-
194
-
195
-
196
-
197
-
198
-
199
-
200
-
201
-
202
-
203
-
204
-
205
-
206
-
207
-
208
-
209
-
210
-
211
-
212
-
213
-
214
-
215
-
216
-
217
-
218
-
219
-
220
-
221
-
222
-
223
-
224
-
225
-
226
-
227
-
228
-
229
-
230
-
231
-
232
-
233
-
234
-
235
-
236
-
237
-
238
-
239
-
240
-
241
-
242
-
243
-
244
-
245
-
246
-
247
-
248
-
249
-
250
-
251
-
252
-
253
-
254
-
255
-
256
-
257
-
258
-
259
-
260
-
261
-
262
-
263
-
264
-
265
-
266
-
267
-
268
-
269
-
270
-
271
-
272
-
273
-
274
-
275
-
276
-
277
-
278
-
279
-
280
-
281
-
282
-
283
-
284
-
285
-
286
-
287
-
288
-
289
-
290
-
291
-
292
-
293
-
294
-
295
-
296
-
297
-
298
-
299
-
 300
300 -
 301
301 -
 302
302 -
 303
303 -
 304
304 -
 305
305 -
 306
306 -
 307
307 -
 308
308 -
 309
309 -
 310
310 -
 311
311 -
 312
312 -
 313
313 -
 314
314 -
 315
315 -
 316
316 -
 317
317 -
 318
318 -
 319
319 -
 320
320 -
321
-
322
-
323
-
324
-
325
-
326
-
327
-
328
-
329
-
330
-
331
-
332
-
333
-
334
-
335
-
336
-
337
-
338
-
339
-
340
-
341
-
342
-
343
-
344
-
345
-
346
-
347
-
348
-
349
-
350
-
351
-
352
-
353
-
354
-
355
-
356
-
357
-
358
-
359
-
360
-
361
-
362
-
363
-
364
-
365
-
366
-
367
-
368
-
369
-
370
-
371
-
372
-
373
-
374
-
375
-
376
-
377
-
378
-
379
-
380
-
381
-
382
-
383
-
384
-
385
-
386
-
387
-
388
-
389
-
390
-
391
-
392
-
393
-
394
-
395
-
396
 |
 |

HSBC HOLDINGS PLC
Notes on the Financial Statements (continued)
16 – Fair values of financial instruments carried at fair value
308
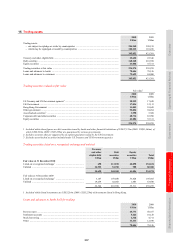
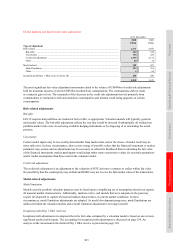
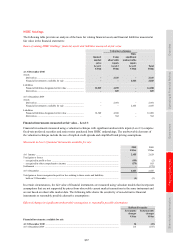
Loans and advances to customers held for trading
2010 2009
US$m US$m
Reverse repos ......................................................................................................................................... 46,366 42,172
Settlement accounts ............................................................................................................................... 7,516 12,134
Stock borrowing .................................................................................................................................... 11,161 18,042
Other ...................................................................................................................................................... 14,579 11,652
79,622 84,000
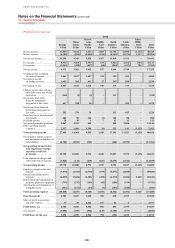
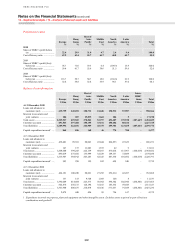
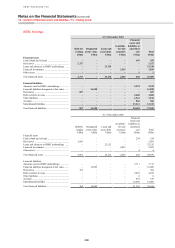
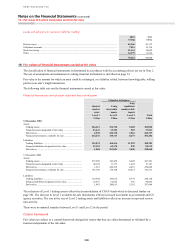
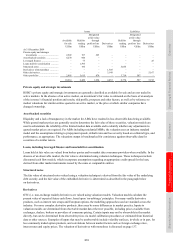
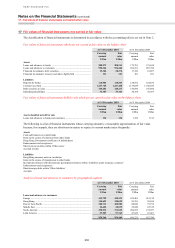
16 Fair values of financial instruments carried at fair value
The classification of financial instruments is determined in accordance with the accounting policies set out in Note 2.
The use of assumptions and estimation in valuing financial instruments is described on page 34.
Fair value is the amount for which an asset could be exchanged, or a liability settled, between knowledgeable, willing
parties in an arm’s length transaction.
The following table sets out the financial instruments carried at fair value.
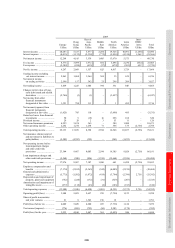
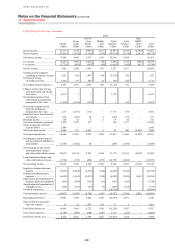
Financial instruments carried at fair value and bases of valuation
Valuation techniques
Quoted
market
price
Level 1
Using
observable
inputs
Level 2
With
significant
unobservable
inputs
Level 3 Total
US$m US$m US$m US$m
31 December 2010
Assets
Trading assets ........................................................................ 224,613 154,750 5,689 385,052
Financial assets designated at fair value ............................... 23,641 12,783 587 37,011
Derivatives ............................................................................. 2,078 254,718 3,961 260,757
Financial investments: available for sale .............................. 214,276 158,743 8,237 381,256
Liabilities
Trading liabilities .................................................................. 124,874 164,436 11,393 300,703
Financial liabilities designated at fair value .......................... 22,193 65,370 570 88,133
Derivatives ............................................................................. 1,808 253,051 3,806 258,665
31 December 2009
Assets
Trading assets ........................................................................ 272,509 142,452 6,420 421,381
Financial assets designated at fair value ............................... 24,184 11,773 1,224 37,181
Derivatives ............................................................................. 1,961 244,472 4,453 250,886
Financial investments: available for sale .............................. 163,149 178,168 10,214 351,531
Liabilities
Trading liabilities .................................................................. 119,544 139,812 8,774 268,130
Financial liabilities designated at fair value .......................... 27,553 52,032 507 80,092
Derivatives ............................................................................. 1,843 240,611 5,192 247,646
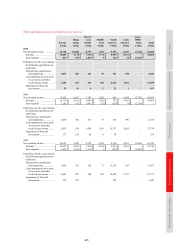
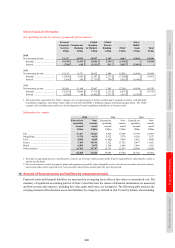
The reduction of Level 1 trading assets reflects the deconsolidation of CNAV funds which is discussed further on
page 363. The increase in Level 1 available-for-sale instruments reflects increased investment in government and US
agency securities. The rise in the size of Level 2 trading assets and liabilities reflects an increase in repo and reverse
repo activity.
There were no material transfers between Level 1 and Level 2 in the period.
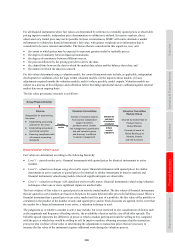
Control framework
Fair values are subject to a control framework designed to ensure that they are either determined or validated by a
function independent of the risk-taker.