HSBC 2010 Annual Report Download - page 134
Download and view the complete annual report
Please find page 134 of the 2010 HSBC annual report below. You can navigate through the pages in the report by either clicking on the pages listed below, or by using the keyword search tool below to find specific information within the annual report.-
 1
1 -
2
-
3
-
4
-
5
-
6
-
7
-
8
-
9
-
10
-
11
-
12
-
13
-
14
-
15
-
16
-
17
-
18
-
19
-
20
-
21
-
22
-
23
-
24
-
25
-
26
-
27
-
28
-
29
-
30
-
31
-
32
-
33
-
34
-
35
-
36
-
37
-
38
-
39
-
40
-
41
-
42
-
43
-
44
-
45
-
46
-
47
-
48
-
49
-
50
-
51
-
52
-
53
-
54
-
55
-
56
-
57
-
58
-
59
-
60
-
61
-
62
-
63
-
64
-
65
-
66
-
67
-
68
-
69
-
70
-
71
-
72
-
73
-
74
-
75
-
76
-
77
-
78
-
79
-
80
-
81
-
82
-
83
-
84
-
85
-
86
-
87
-
88
-
89
-
90
-
91
-
92
-
93
-
94
-
95
-
96
-
97
-
98
-
99
-
100
-
101
-
102
-
103
-
104
-
105
-
106
-
107
-
108
-
109
-
110
-
111
-
112
-
113
-
114
-
115
-
116
-
117
-
118
-
119
-
120
-
121
-
122
-
123
-
 124
124 -
 125
125 -
 126
126 -
 127
127 -
 128
128 -
 129
129 -
 130
130 -
 131
131 -
 132
132 -
 133
133 -
 134
134 -
 135
135 -
 136
136 -
 137
137 -
 138
138 -
 139
139 -
 140
140 -
 141
141 -
 142
142 -
 143
143 -
 144
144 -
145
-
146
-
147
-
148
-
149
-
150
-
151
-
152
-
153
-
154
-
155
-
156
-
157
-
158
-
159
-
160
-
161
-
162
-
163
-
164
-
165
-
166
-
167
-
168
-
169
-
170
-
171
-
172
-
173
-
174
-
175
-
176
-
177
-
178
-
179
-
180
-
181
-
182
-
183
-
184
-
185
-
186
-
187
-
188
-
189
-
190
-
191
-
192
-
193
-
194
-
195
-
196
-
197
-
198
-
199
-
200
-
201
-
202
-
203
-
204
-
205
-
206
-
207
-
208
-
209
-
210
-
211
-
212
-
213
-
214
-
215
-
216
-
217
-
218
-
219
-
220
-
221
-
222
-
223
-
224
-
225
-
226
-
227
-
228
-
229
-
230
-
231
-
232
-
233
-
234
-
235
-
236
-
237
-
238
-
239
-
240
-
241
-
242
-
243
-
244
-
245
-
246
-
247
-
248
-
249
-
250
-
251
-
252
-
253
-
254
-
255
-
256
-
257
-
258
-
259
-
260
-
261
-
262
-
263
-
264
-
265
-
266
-
267
-
268
-
269
-
270
-
271
-
272
-
273
-
274
-
275
-
276
-
277
-
278
-
279
-
280
-
281
-
282
-
283
-
284
-
285
-
286
-
287
-
288
-
289
-
290
-
291
-
292
-
293
-
294
-
295
-
296
-
297
-
298
-
299
-
300
-
301
-
302
-
303
-
304
-
305
-
306
-
307
-
308
-
309
-
310
-
311
-
312
-
313
-
314
-
315
-
316
-
317
-
318
-
319
-
320
-
321
-
322
-
323
-
324
-
325
-
326
-
327
-
328
-
329
-
330
-
331
-
332
-
333
-
334
-
335
-
336
-
337
-
338
-
339
-
340
-
341
-
342
-
343
-
344
-
345
-
346
-
347
-
348
-
349
-
350
-
351
-
352
-
353
-
354
-
355
-
356
-
357
-
358
-
359
-
360
-
361
-
362
-
363
-
364
-
365
-
366
-
367
-
368
-
369
-
370
-
371
-
372
-
373
-
374
-
375
-
376
-
377
-
378
-
379
-
380
-
381
-
382
-
383
-
384
-
385
-
386
-
387
-
388
-
389
-
390
-
391
-
392
-
393
-
394
-
395
-
396
 |
 |

HSBC HOLDINGS PLC
Report of the Directors: Operating and Financial Review (continued)
Risk > Credit risk > Securitisation exposures and other structured products
132
pools and models their projected future cash flows.
The estimated future cash flows of the securities
are assessed at the specific financial asset level to
determine whether any of them are unlikely to be
recovered as a result of loss events occurring on or
before the reporting date.
The principal assumptions and inputs to the
models are typically the delinquency status of the
underlying loans, the probability of delinquent
loans progressing to default, the prepayment
profiles of the underlying assets and the loss
severity in the event of default. However, the
models utilise other variables relevant to specific
classes of collateral to forecast future defaults
and recovery rates. Management uses externally
available data and applies judgement when
determining the appropriate assumptions in respect
of these factors. HSBC uses a modelling approach
which incorporates historically observed
progression rates to default, to determine if the
decline in aggregate projected cash flows from
the underlying collateral will lead to a shortfall in
contractual cash flows. In such cases the security
is considered to be impaired.
In respect of CDOs, expected future cash
flows for the underlying collateral are assessed to
determine whether there is likely to be a shortfall
in the contractual cash flows of the CDO.
When a security benefits from a contract
provided by a monoline insurer that insures
payments of principal and interest, the expected
recovery on the contract is assessed in determining
the total expected credit support available to the
ABS.
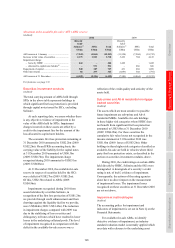
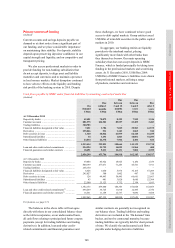
Impairment and cash loss projections
(Unaudited)
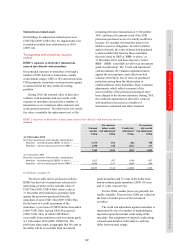
At 31 December 2009, management undertook
an analysis to estimate further potential
impairments and expected cash losses on the
available-for-sale ABS portfolio. This exercise
comprised a shift of projections of future loss
severities, default rates and prepayment rates.
The results of the analysis indicated that further
impairment charges of some US$1.1bn and
expected cash losses of some US$450m could
arise over the next two to three years.
At 31 December 2010, management
re-performed the stress test. After taking into
account the cash losses experienced during 2010,
the remaining cash loss projections of US$250m
were consistent with those as at 31 December 2009.
However, the impairment charge projections
showed an additional charge of US$300m arising
over the next two years in relation to the SICs, after
taking into account the impairments recognised in
2010, resulting in future impairment charges of
US$950m, including the US$300m relating to the
SICs. This additional charge reflects where the
accounting impairments will exceed the carrying
amount of the capital notes held by third parties.
For the purposes of identifying impairment at
the reporting date, the future projected cash flows
reflect the effect of loss events that have occurred
at or prior to the reporting date. For the purposes of
performing stress tests to estimate potential future
impairment charges, the projected future cash flows
reflect additional assumptions about future loss
events after the balance sheet date.
This analysis makes assumptions in respect
of the future behaviour of loss severities, default
rates and prepayment rates. Movements in the
parameters are not independent of each other. For
example, increased default rates and increased loss
severities, which would imply greater impairments,
generally arise under economic conditions that give
rise to reduced levels of prepayment, reducing the
potential for impairment charges. Conversely,
economic conditions which increase the rates of
prepayment are generally associated with reduced
default rates and decreased loss severities.
At 31 December 2010, the incurred and
projected impairment charges, measured in
accordance with accounting requirements,
significantly exceeded the expected cash losses on
the securities. Over the lives of the available-for-
sale ABSs the cumulative impairment charges will
converge towards the level of cash losses. In
respect of the SICs, in particular, the capital notes
held by third parties are expected to absorb the cash
losses arising in the vehicles.