HSBC 2010 Annual Report Download - page 316
Download and view the complete annual report
Please find page 316 of the 2010 HSBC annual report below. You can navigate through the pages in the report by either clicking on the pages listed below, or by using the keyword search tool below to find specific information within the annual report.-
 1
1 -
2
-
3
-
4
-
5
-
6
-
7
-
8
-
9
-
10
-
11
-
12
-
13
-
14
-
15
-
16
-
17
-
18
-
19
-
20
-
21
-
22
-
23
-
24
-
25
-
26
-
27
-
28
-
29
-
30
-
31
-
32
-
33
-
34
-
35
-
36
-
37
-
38
-
39
-
40
-
41
-
42
-
43
-
44
-
45
-
46
-
47
-
48
-
49
-
50
-
51
-
52
-
53
-
54
-
55
-
56
-
57
-
58
-
59
-
60
-
61
-
62
-
63
-
64
-
65
-
66
-
67
-
68
-
69
-
70
-
71
-
72
-
73
-
74
-
75
-
76
-
77
-
78
-
79
-
80
-
81
-
82
-
83
-
84
-
85
-
86
-
87
-
88
-
89
-
90
-
91
-
92
-
93
-
94
-
95
-
96
-
97
-
98
-
99
-
100
-
101
-
102
-
103
-
104
-
105
-
106
-
107
-
108
-
109
-
110
-
111
-
112
-
113
-
114
-
115
-
116
-
117
-
118
-
119
-
120
-
121
-
122
-
123
-
124
-
125
-
126
-
127
-
128
-
129
-
130
-
131
-
132
-
133
-
134
-
135
-
136
-
137
-
138
-
139
-
140
-
141
-
142
-
143
-
144
-
145
-
146
-
147
-
148
-
149
-
150
-
151
-
152
-
153
-
154
-
155
-
156
-
157
-
158
-
159
-
160
-
161
-
162
-
163
-
164
-
165
-
166
-
167
-
168
-
169
-
170
-
171
-
172
-
173
-
174
-
175
-
176
-
177
-
178
-
179
-
180
-
181
-
182
-
183
-
184
-
185
-
186
-
187
-
188
-
189
-
190
-
191
-
192
-
193
-
194
-
195
-
196
-
197
-
198
-
199
-
200
-
201
-
202
-
203
-
204
-
205
-
206
-
207
-
208
-
209
-
210
-
211
-
212
-
213
-
214
-
215
-
216
-
217
-
218
-
219
-
220
-
221
-
222
-
223
-
224
-
225
-
226
-
227
-
228
-
229
-
230
-
231
-
232
-
233
-
234
-
235
-
236
-
237
-
238
-
239
-
240
-
241
-
242
-
243
-
244
-
245
-
246
-
247
-
248
-
249
-
250
-
251
-
252
-
253
-
254
-
255
-
256
-
257
-
258
-
259
-
260
-
261
-
262
-
263
-
264
-
265
-
266
-
267
-
268
-
269
-
270
-
271
-
272
-
273
-
274
-
275
-
276
-
277
-
278
-
279
-
280
-
281
-
282
-
283
-
284
-
285
-
286
-
287
-
288
-
289
-
290
-
291
-
292
-
293
-
294
-
295
-
296
-
297
-
298
-
299
-
300
-
301
-
302
-
303
-
304
-
305
-
 306
306 -
 307
307 -
 308
308 -
 309
309 -
 310
310 -
 311
311 -
 312
312 -
 313
313 -
 314
314 -
 315
315 -
 316
316 -
 317
317 -
 318
318 -
 319
319 -
 320
320 -
 321
321 -
 322
322 -
 323
323 -
 324
324 -
 325
325 -
 326
326 -
327
-
328
-
329
-
330
-
331
-
332
-
333
-
334
-
335
-
336
-
337
-
338
-
339
-
340
-
341
-
342
-
343
-
344
-
345
-
346
-
347
-
348
-
349
-
350
-
351
-
352
-
353
-
354
-
355
-
356
-
357
-
358
-
359
-
360
-
361
-
362
-
363
-
364
-
365
-
366
-
367
-
368
-
369
-
370
-
371
-
372
-
373
-
374
-
375
-
376
-
377
-
378
-
379
-
380
-
381
-
382
-
383
-
384
-
385
-
386
-
387
-
388
-
389
-
390
-
391
-
392
-
393
-
394
-
395
-
396
 |
 |

HSBC HOLDINGS PLC
Notes on the Financial Statements (continued)
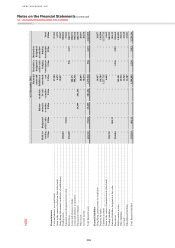
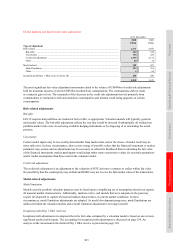
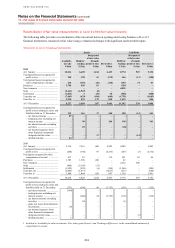
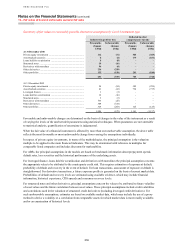
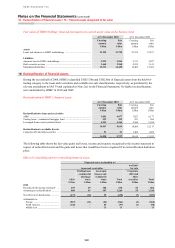
16 – Fair values of financial instruments carried at fair value
314
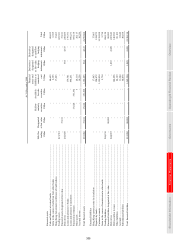
Reconciliation of fair value measurements in Level 3 of the fair value hierarchy
The following table provides a reconciliation of the movement between opening and closing balances of Level 3
financial instruments, measured at fair value using a valuation technique with significant unobservable inputs:
Movement in Level 3 financial instruments
Assets Liabilities
Available
for sale
Held for
trading
Designated
at fair value
through
profit or loss Derivatives
Held for
trading
Designated
at fair value
through
profit or loss
Derivatives
US$m US$m US$m US$m US$m US$m US$m
2010
At 1 January ...................................... 10,214 6,420 1,224 4,453 8,774 507 5,192
Total gains/(losses) recognised in
profit or loss ................................. 345 158 63 (675) 166 (11) (240)
Total gains/(losses) recognised in
other comprehensive income1 ...... 618 (101) (36) (110) (157) 74 93
Purchases .......................................... 3,708 858 81 – (356) – –
New issuances ................................... – – – – 4,025 – –
Sales .................................................. (2,461) (1,543) (8) – – – –
Settlements ........................................ (1,032) 1 (22) 64 (948) – (820)
Transfers out ..................................... (7,065) (629) (894) (669) (1,750) – (1,003)
Transfers in ....................................... 3,910 525 179 898 1,639 – 584
At 31 December ................................ 8,237 5,689 587 3,961 11,393 570 3,806
Total gains/(losses) recognised in
profit or loss relating to assets and
liabilities held on 31 December: 113 116 17 268 180 (14) 361
– net interest income ................... 89 – – – – – –
– trading income excluding net
interest income ......................... – 98 –268 198 – 361
– net interest income on trading
activities ................................... – 18 – – (18) – –
– net income/(expense) from
other financial instruments
designated at fair value ............ – –17 –– (14) –
– dividend income ....................... 24 – – – – – –
2009
At 1 January ...................................... 9,116 7,561 460 9,883 6,509 – 3,805
Total gains/(losses) recognised in
profit or loss ................................. (260) (730) 97 (5,275) (107) (3) (1,372)
Total gains recognised in other
comprehensive income1 ................ 617 85 – 119 301 10 94
Purchases .......................................... 1,785 1,598 260 – 22 – –
New issuances ................................... – – – – 2,522 500 –
Sales .................................................. (806) (2,166) (13) – – – –
Settlements ........................................ (1,059) (295) (6) (104) (1,266) – (206)
Transfers out ..................................... (3,043) (1,077) – (1,057) (537) – (620)
Transfers in ....................................... 3,864 1,444 426 887 1,330 – 3,491
At 31 December ................................ 10,214 6,420 1,224 4,453 8,774 507 5,192
Total gains/(losses) recognised in
profit or loss relating to assets and
liabilities held on 31 December: (371) (596) 98 (3,753) (136) (3) (135)
– net interest income ................... (364) – – – – – –
– trading income excluding net
interest income ......................... – (640) 98 (3,753) (135) – (135)
– net interest income on trading
activities ................................... – 44 – – (1) – –
– gains less losses from financial
investments ............................... (9) – – – – – –
– net income/(expense) from
other financial instruments
designated at fair value ............ – – – – – (3) –
– dividend income ....................... 2 – – – – – –
1 Included in ‘Available-for-sale investments: Fair value gains/(losses)’ and ‘Exchange differences’ in the consolidated statement of
comprehensive income.