HSBC 2010 Annual Report Download - page 175
Download and view the complete annual report
Please find page 175 of the 2010 HSBC annual report below. You can navigate through the pages in the report by either clicking on the pages listed below, or by using the keyword search tool below to find specific information within the annual report.-
 1
1 -
2
-
3
-
4
-
5
-
6
-
7
-
8
-
9
-
10
-
11
-
12
-
13
-
14
-
15
-
16
-
17
-
18
-
19
-
20
-
21
-
22
-
23
-
24
-
25
-
26
-
27
-
28
-
29
-
30
-
31
-
32
-
33
-
34
-
35
-
36
-
37
-
38
-
39
-
40
-
41
-
42
-
43
-
44
-
45
-
46
-
47
-
48
-
49
-
50
-
51
-
52
-
53
-
54
-
55
-
56
-
57
-
58
-
59
-
60
-
61
-
62
-
63
-
64
-
65
-
66
-
67
-
68
-
69
-
70
-
71
-
72
-
73
-
74
-
75
-
76
-
77
-
78
-
79
-
80
-
81
-
82
-
83
-
84
-
85
-
86
-
87
-
88
-
89
-
90
-
91
-
92
-
93
-
94
-
95
-
96
-
97
-
98
-
99
-
100
-
101
-
102
-
103
-
104
-
105
-
106
-
107
-
108
-
109
-
110
-
111
-
112
-
113
-
114
-
115
-
116
-
117
-
118
-
119
-
120
-
121
-
122
-
123
-
124
-
125
-
126
-
127
-
128
-
129
-
130
-
131
-
132
-
133
-
134
-
135
-
136
-
137
-
138
-
139
-
140
-
141
-
142
-
143
-
144
-
145
-
146
-
147
-
148
-
149
-
150
-
151
-
152
-
153
-
154
-
155
-
156
-
157
-
158
-
159
-
160
-
161
-
162
-
163
-
164
-
 165
165 -
 166
166 -
 167
167 -
 168
168 -
 169
169 -
 170
170 -
 171
171 -
 172
172 -
 173
173 -
 174
174 -
 175
175 -
 176
176 -
 177
177 -
 178
178 -
 179
179 -
 180
180 -
 181
181 -
 182
182 -
 183
183 -
 184
184 -
 185
185 -
186
-
187
-
188
-
189
-
190
-
191
-
192
-
193
-
194
-
195
-
196
-
197
-
198
-
199
-
200
-
201
-
202
-
203
-
204
-
205
-
206
-
207
-
208
-
209
-
210
-
211
-
212
-
213
-
214
-
215
-
216
-
217
-
218
-
219
-
220
-
221
-
222
-
223
-
224
-
225
-
226
-
227
-
228
-
229
-
230
-
231
-
232
-
233
-
234
-
235
-
236
-
237
-
238
-
239
-
240
-
241
-
242
-
243
-
244
-
245
-
246
-
247
-
248
-
249
-
250
-
251
-
252
-
253
-
254
-
255
-
256
-
257
-
258
-
259
-
260
-
261
-
262
-
263
-
264
-
265
-
266
-
267
-
268
-
269
-
270
-
271
-
272
-
273
-
274
-
275
-
276
-
277
-
278
-
279
-
280
-
281
-
282
-
283
-
284
-
285
-
286
-
287
-
288
-
289
-
290
-
291
-
292
-
293
-
294
-
295
-
296
-
297
-
298
-
299
-
300
-
301
-
302
-
303
-
304
-
305
-
306
-
307
-
308
-
309
-
310
-
311
-
312
-
313
-
314
-
315
-
316
-
317
-
318
-
319
-
320
-
321
-
322
-
323
-
324
-
325
-
326
-
327
-
328
-
329
-
330
-
331
-
332
-
333
-
334
-
335
-
336
-
337
-
338
-
339
-
340
-
341
-
342
-
343
-
344
-
345
-
346
-
347
-
348
-
349
-
350
-
351
-
352
-
353
-
354
-
355
-
356
-
357
-
358
-
359
-
360
-
361
-
362
-
363
-
364
-
365
-
366
-
367
-
368
-
369
-
370
-
371
-
372
-
373
-
374
-
375
-
376
-
377
-
378
-
379
-
380
-
381
-
382
-
383
-
384
-
385
-
386
-
387
-
388
-
389
-
390
-
391
-
392
-
393
-
394
-
395
-
396
 |
 |

173
Overview Operating & Financial Review Governance Financial Statements Shareholder Information
investment objectives of both HSBC and, where
relevant and appropriate, the trustees are:
• to limit the risk of the assets failing to meet the
liabilities of the plans over the long-term; and
• to maximise returns consistent with an
acceptable level of risk so as to control the
long-term costs of the defined benefit plans.
In pursuit of these long-term objectives, a
benchmark is established for the allocation of the
defined benefit plan assets between asset classes.
In addition, each permitted asset class has its own
benchmarks, such as stock market or property
valuation indices and, where relevant, desired levels
of out-performance. The benchmarks are reviewed
at least triennially within 18 months of the date at
which an actuarial valuation is made, or more
frequently if required by local legislation or
circumstances. The process generally involves an
extensive asset and liability review.
Ultimate responsibility for investment strategy
rests with either the trustees or, in certain
circumstances, a Management Committee. The
degree of independence of the trustees from HSBC
varies in different jurisdictions. For example, the
principal plan, which accounts for approximately
70% of the obligations of our defined benefit
pension plans, is overseen by a corporate trustee who
regularly monitors the market risks inherent in the
scheme.
The principal plan holds a diversified portfolio
of investments to meet future cash flow liabilities
arising from accrued benefits as they fall due to be
paid. The trustee of the principal plan is required to
produce a written Statement of Investment Principles
which governs decision-making about how
investments are made.
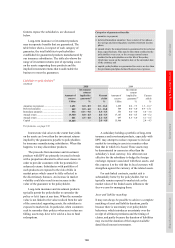
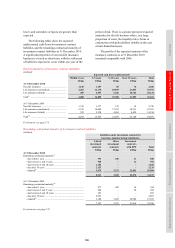
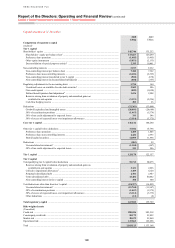
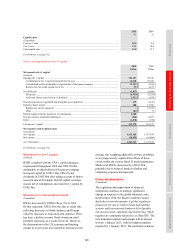
The DBS principal plan – asset allocation
2010 2006
% %
Equities ........................................ 15.5 15.0
Bonds ........................................... 56.5 50.0
Alternative assets93 ...................... 10.5 10.0
Property ........................................ 9.0 10.0
Cash ............................................. 8.5 15.0
100.0 100.0
For footnote, see page 174.
In 2006, HSBC and the trustee of the principal
plan agreed to change the investment strategy in
order to reduce the investment risk. The target asset
allocations for this strategy at that time and as
revised in 2010 are shown above. The strategy is to
hold the majority of assets in bonds, with the
remainder in a more diverse range of investments,
and includes a commitment to undertake a
programme of swap arrangements (see Note 45 on
the Financial Statements) by which the principal
plan makes LIBOR-related interest payments in
exchange for the receipt of cash flows which are
based on projected future benefit payments to be
made from the principal plan.
Sustainability risk
(Unaudited)
Assessing the environmental and social
impacts of providing finance to our
customers has been firmly embedded into
our overall risk management processes.
Sustainability risks arise from the provision of
financial services to companies or projects which run
counter to the needs of sustainable development; in
effect this risk arises when the environmental and
social effects outweigh economic benefits. Within
GMO, a separate function, Group Corporate
Sustainability, is mandated to manage these risks
globally working through local offices as
appropriate. Sustainability Risk Managers have
regional or national responsibilities for advising on
and managing environmental and social risks.
Group Corporate Sustainability’s risk
management responsibilities include:
• formulating sustainability risk policies. This
includes oversight of our sustainability risk
standards, management of the Equator
Principles for project finance lending, and
sector-based sustainability policies covering
those sectors with high environmental or social
impacts (forestry, freshwater infrastructure,
chemicals, energy, mining and metals, and
defence-related lending); undertaking an
independent review of transactions where
sustainability risks are assessed to be high, and
supporting our operating companies to assess
similar risks of a lower magnitude;
• building and implementing systems-based
processes to ensure consistent application of
policies, reduce the costs of sustainability risk
reviews and capture management information to
measure and report on the effect of our lending
and investment activities on sustainable
development; and
• providing training and capacity building within
our operating companies to ensure sustainability
risks are identified and mitigated consistently to
either our own standards, international standards
or local regulations, whichever is higher.