HSBC 2010 Annual Report Download - page 153
Download and view the complete annual report
Please find page 153 of the 2010 HSBC annual report below. You can navigate through the pages in the report by either clicking on the pages listed below, or by using the keyword search tool below to find specific information within the annual report.-
 1
1 -
2
-
3
-
4
-
5
-
6
-
7
-
8
-
9
-
10
-
11
-
12
-
13
-
14
-
15
-
16
-
17
-
18
-
19
-
20
-
21
-
22
-
23
-
24
-
25
-
26
-
27
-
28
-
29
-
30
-
31
-
32
-
33
-
34
-
35
-
36
-
37
-
38
-
39
-
40
-
41
-
42
-
43
-
44
-
45
-
46
-
47
-
48
-
49
-
50
-
51
-
52
-
53
-
54
-
55
-
56
-
57
-
58
-
59
-
60
-
61
-
62
-
63
-
64
-
65
-
66
-
67
-
68
-
69
-
70
-
71
-
72
-
73
-
74
-
75
-
76
-
77
-
78
-
79
-
80
-
81
-
82
-
83
-
84
-
85
-
86
-
87
-
88
-
89
-
90
-
91
-
92
-
93
-
94
-
95
-
96
-
97
-
98
-
99
-
100
-
101
-
102
-
103
-
104
-
105
-
106
-
107
-
108
-
109
-
110
-
111
-
112
-
113
-
114
-
115
-
116
-
117
-
118
-
119
-
120
-
121
-
122
-
123
-
124
-
125
-
126
-
127
-
128
-
129
-
130
-
131
-
132
-
133
-
134
-
135
-
136
-
137
-
138
-
139
-
140
-
141
-
142
-
 143
143 -
 144
144 -
 145
145 -
 146
146 -
 147
147 -
 148
148 -
 149
149 -
 150
150 -
 151
151 -
 152
152 -
 153
153 -
 154
154 -
 155
155 -
 156
156 -
 157
157 -
 158
158 -
 159
159 -
 160
160 -
 161
161 -
 162
162 -
 163
163 -
164
-
165
-
166
-
167
-
168
-
169
-
170
-
171
-
172
-
173
-
174
-
175
-
176
-
177
-
178
-
179
-
180
-
181
-
182
-
183
-
184
-
185
-
186
-
187
-
188
-
189
-
190
-
191
-
192
-
193
-
194
-
195
-
196
-
197
-
198
-
199
-
200
-
201
-
202
-
203
-
204
-
205
-
206
-
207
-
208
-
209
-
210
-
211
-
212
-
213
-
214
-
215
-
216
-
217
-
218
-
219
-
220
-
221
-
222
-
223
-
224
-
225
-
226
-
227
-
228
-
229
-
230
-
231
-
232
-
233
-
234
-
235
-
236
-
237
-
238
-
239
-
240
-
241
-
242
-
243
-
244
-
245
-
246
-
247
-
248
-
249
-
250
-
251
-
252
-
253
-
254
-
255
-
256
-
257
-
258
-
259
-
260
-
261
-
262
-
263
-
264
-
265
-
266
-
267
-
268
-
269
-
270
-
271
-
272
-
273
-
274
-
275
-
276
-
277
-
278
-
279
-
280
-
281
-
282
-
283
-
284
-
285
-
286
-
287
-
288
-
289
-
290
-
291
-
292
-
293
-
294
-
295
-
296
-
297
-
298
-
299
-
300
-
301
-
302
-
303
-
304
-
305
-
306
-
307
-
308
-
309
-
310
-
311
-
312
-
313
-
314
-
315
-
316
-
317
-
318
-
319
-
320
-
321
-
322
-
323
-
324
-
325
-
326
-
327
-
328
-
329
-
330
-
331
-
332
-
333
-
334
-
335
-
336
-
337
-
338
-
339
-
340
-
341
-
342
-
343
-
344
-
345
-
346
-
347
-
348
-
349
-
350
-
351
-
352
-
353
-
354
-
355
-
356
-
357
-
358
-
359
-
360
-
361
-
362
-
363
-
364
-
365
-
366
-
367
-
368
-
369
-
370
-
371
-
372
-
373
-
374
-
375
-
376
-
377
-
378
-
379
-
380
-
381
-
382
-
383
-
384
-
385
-
386
-
387
-
388
-
389
-
390
-
391
-
392
-
393
-
394
-
395
-
396
 |
 |

151
Overview Operating & Financial Review Governance Financial Statements Shareholder Information
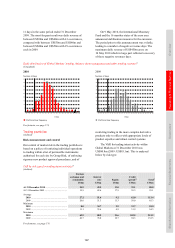
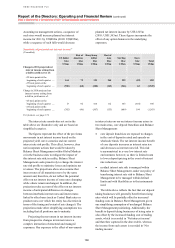
The main drivers of the year on year changes in
the sensitivity of the Group’s net interest income to
the change in rates shown in the table were lower
implied yield curves, changes in Balance Sheet
Management positioning, and changed expectations
for deposit pricing for some currencies in a rising
rate environment.
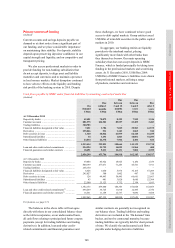
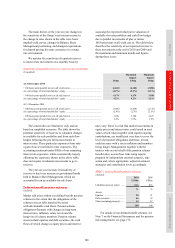
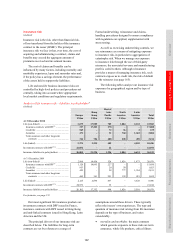
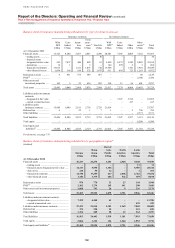
We monitor the sensitivity of reported reserves
to interest rate movements on a monthly basis by
assessing the expected reduction in valuation of
available-for-sale portfolios and cash flow hedges
due to parallel movements of plus or minus
100 basis points in all yield curves. The table below
describes the sensitivity of our reported reserves to
these movements at the end of 2010 and 2009 and
the maximum and minimum month-end figures
during these years:
Sensitivity of reported reserves to interest rate movements
(Unaudited)
US$m
Maximum
impact
US$m
Minimum
impact
US$m
At 31 December 2010
+ 100 basis point parallel move in all yield curves .................................................... (6,162) (6,162) (3,096)
As a percentage of total shareholders’ equity ............................................................ (4.2%) (4.2%) (2.1%)
– 100 basis point parallel move in all yield curves .................................................... 6,174 6,174 3,108
As a percentage of total shareholders’ equity ............................................................ 4.2% 4.2% 2.1%
At 31 December 2009
+ 100 basis point parallel move in all yield curves .................................................... (3,096) (3,438) (2,715)
As a percentage of total shareholders’ equity ............................................................ (2.4%) (2.7%) (2.1%)
– 100 basis point parallel move in all yield curves .................................................... 3,108 3,380 2,477
As a percentage of total shareholders’ equity ............................................................ 2.4% 2.6% 1.9%
The sensitivities are illustrative only and are
based on simplified scenarios. The table shows the
potential sensitivity of reserves to valuation changes
in available-for-sale portfolios and from cash flow
hedges following the pro forma movements in
interest rates. These particular exposures form only
a part of our overall interest rate exposures. The
accounting treatment under IFRSs of our remaining
interest rate exposures, while economically largely
offsetting the exposures shown in the above table,
does not require revaluation movements to go to
reserves.
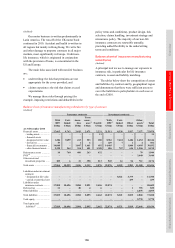
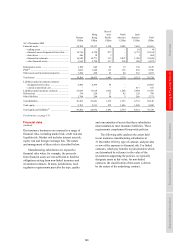
The year-on-year increase in sensitivity of
reserves is due to an increase in government bonds
held in Balance Sheet Management, which are
accounted for on an available-for-sale basis.
Defined benefit pension schemes
(Audited)
Market risk arises within our defined benefit pension
schemes to the extent that the obligations of the
schemes are not fully matched by assets
with determinable cash flows. Pension scheme
obligations fluctuate with changes in long-term
interest rates, inflation, salary levels and the
longevity of scheme members. Pension scheme
assets include equities and debt securities, the cash
flows of which change as equity prices and interest
rates vary. There is a risk that market movements in
equity prices and interest rates could result in asset
values which, taken together with regular ongoing
contributions, are insufficient over time to cover the
level of projected obligations and these, in turn,
could increase with a rise in inflation and members
living longer. Management, together with the
trustees who act on behalf of the pension scheme
beneficiaries, assess these risks using reports
prepared by independent external actuaries, take
action and, where appropriate, adjust investment
strategies and contribution levels accordingly.
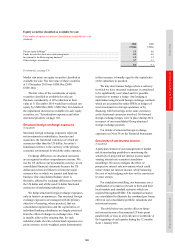
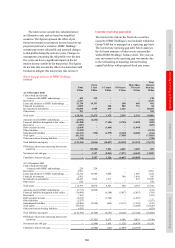
HSBC’s defined benefit pension schemes
(Audited)
2010 2009
US$bn US$bn
Liabilities (present value) ....... 32.6 30.6
% %
Assets:
Equities ................................... 20 21
Debt securities ........................ 66 67
Other (including property) ...... 14 12
100 100
For details of our defined benefit schemes, see
Note 7 on the Financial Statements, and for pension
risk management, see page 172.