HSBC 2010 Annual Report Download - page 117
Download and view the complete annual report
Please find page 117 of the 2010 HSBC annual report below. You can navigate through the pages in the report by either clicking on the pages listed below, or by using the keyword search tool below to find specific information within the annual report.-
 1
1 -
2
-
3
-
4
-
5
-
6
-
7
-
8
-
9
-
10
-
11
-
12
-
13
-
14
-
15
-
16
-
17
-
18
-
19
-
20
-
21
-
22
-
23
-
24
-
25
-
26
-
27
-
28
-
29
-
30
-
31
-
32
-
33
-
34
-
35
-
36
-
37
-
38
-
39
-
40
-
41
-
42
-
43
-
44
-
45
-
46
-
47
-
48
-
49
-
50
-
51
-
52
-
53
-
54
-
55
-
56
-
57
-
58
-
59
-
60
-
61
-
62
-
63
-
64
-
65
-
66
-
67
-
68
-
69
-
70
-
71
-
72
-
73
-
74
-
75
-
76
-
77
-
78
-
79
-
80
-
81
-
82
-
83
-
84
-
85
-
86
-
87
-
88
-
89
-
90
-
91
-
92
-
93
-
94
-
95
-
96
-
97
-
98
-
99
-
100
-
101
-
102
-
103
-
104
-
105
-
106
-
 107
107 -
 108
108 -
 109
109 -
 110
110 -
 111
111 -
 112
112 -
 113
113 -
 114
114 -
 115
115 -
 116
116 -
 117
117 -
 118
118 -
 119
119 -
 120
120 -
 121
121 -
 122
122 -
 123
123 -
 124
124 -
 125
125 -
 126
126 -
 127
127 -
128
-
129
-
130
-
131
-
132
-
133
-
134
-
135
-
136
-
137
-
138
-
139
-
140
-
141
-
142
-
143
-
144
-
145
-
146
-
147
-
148
-
149
-
150
-
151
-
152
-
153
-
154
-
155
-
156
-
157
-
158
-
159
-
160
-
161
-
162
-
163
-
164
-
165
-
166
-
167
-
168
-
169
-
170
-
171
-
172
-
173
-
174
-
175
-
176
-
177
-
178
-
179
-
180
-
181
-
182
-
183
-
184
-
185
-
186
-
187
-
188
-
189
-
190
-
191
-
192
-
193
-
194
-
195
-
196
-
197
-
198
-
199
-
200
-
201
-
202
-
203
-
204
-
205
-
206
-
207
-
208
-
209
-
210
-
211
-
212
-
213
-
214
-
215
-
216
-
217
-
218
-
219
-
220
-
221
-
222
-
223
-
224
-
225
-
226
-
227
-
228
-
229
-
230
-
231
-
232
-
233
-
234
-
235
-
236
-
237
-
238
-
239
-
240
-
241
-
242
-
243
-
244
-
245
-
246
-
247
-
248
-
249
-
250
-
251
-
252
-
253
-
254
-
255
-
256
-
257
-
258
-
259
-
260
-
261
-
262
-
263
-
264
-
265
-
266
-
267
-
268
-
269
-
270
-
271
-
272
-
273
-
274
-
275
-
276
-
277
-
278
-
279
-
280
-
281
-
282
-
283
-
284
-
285
-
286
-
287
-
288
-
289
-
290
-
291
-
292
-
293
-
294
-
295
-
296
-
297
-
298
-
299
-
300
-
301
-
302
-
303
-
304
-
305
-
306
-
307
-
308
-
309
-
310
-
311
-
312
-
313
-
314
-
315
-
316
-
317
-
318
-
319
-
320
-
321
-
322
-
323
-
324
-
325
-
326
-
327
-
328
-
329
-
330
-
331
-
332
-
333
-
334
-
335
-
336
-
337
-
338
-
339
-
340
-
341
-
342
-
343
-
344
-
345
-
346
-
347
-
348
-
349
-
350
-
351
-
352
-
353
-
354
-
355
-
356
-
357
-
358
-
359
-
360
-
361
-
362
-
363
-
364
-
365
-
366
-
367
-
368
-
369
-
370
-
371
-
372
-
373
-
374
-
375
-
376
-
377
-
378
-
379
-
380
-
381
-
382
-
383
-
384
-
385
-
386
-
387
-
388
-
389
-
390
-
391
-
392
-
393
-
394
-
395
-
396
 |
 |

115
Overview Operating & Financial Review Governance Financial Statements Shareholder Information
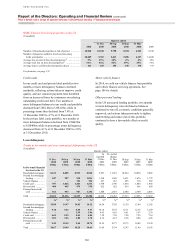
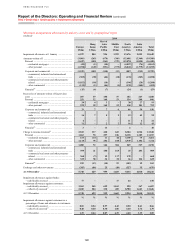
Quality classification definitions
• ‘Strong’: exposures demonstrate a strong capacity to meet
financial commitments, with negligible or low probability of
default and/or low levels of expected loss. Retail accounts
operate within product parameters and only exceptionally
show any period of delinquency.
• ‘Good’: exposures require closer monitoring and demonstrate
a good capacity to meet financial commitments, with low
default risk. Retail accounts typically show only short periods
of delinquency, with any losses expected to be minimal
following the adoption of recovery processes.
• ‘Satisfactory’: exposures require closer monitoring and
demonstrate an average to fair capacity to meet financial
commitments, with moderate default risk. Retail accounts
typically show only short periods of delinquency, with any
losses expected to be minor following the adoption of recovery
processes.
• ‘Sub-standard’: exposures require varying degrees of special
attention and default risk is of greater concern. Retail portfolio
segments show longer delinquency periods of generally up to
90 days past due and/or expected losses are higher due to a
reduced ability to mitigate these through security realisation or
other recovery processes.
• ‘Impaired’: exposures have been assessed, individually or
collectively, as impaired.
The Customer Risk Rating (‘CRR’) 10-grade scale
above summarises a more granular underlying
23-grade scale (2009: 22-grade scale) of obligor
probability of default (‘PD’). The 23-grade scale was
introduced in September 2010 following the
harmonisation of PDs for three asset classes (banks,
sovereigns and corporates) into one scale which
required an additional PD band. All distinct HSBC
customers are rated using the 10 or 23-grade scale,
depending on the degree of sophistication of the
Basel II approach adopted for the exposure.
The Expected Loss (‘EL’) 10-grade scale for
retail business summarises a more granular
underlying EL scale for these customer segments;
this combines obligor and facility/product risk
factors in a composite measure.
For debt securities and certain other financial
instruments, external ratings have been aligned to the
five quality classifications. The ratings of Standard
and Poor’s are cited, with those of other agencies
being treated equivalently. Debt securities with
short-term issue ratings are reported against the
long-term rating of the issuer of those securities. If
major rating agencies have different ratings for the
same debt securities, a prudent rating selection is
made in line with regulatory requirements.
Additional credit quality information in respect
of our consolidated holdings of ABSs is provided on
pages 134 and 135.
For the purpose of the following disclosure,
retail loans which are past due up to 89 days and are
not otherwise classified as EL9 or EL10, are not
disclosed within the EL grade to which they relate,
but are separately classified as past due but not
impaired.
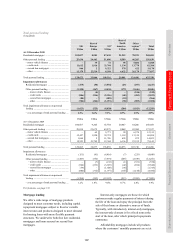
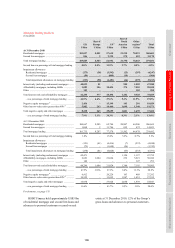
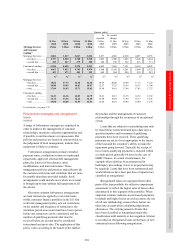
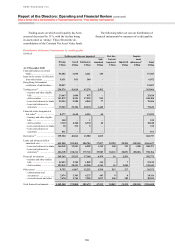
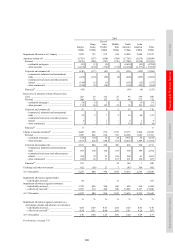
Financial instruments by credit quality
2010 compared with 2009
Financial instruments on which credit quality has
been assessed increased by 4% to US$2,297bn due
to strong growth in lending, mainly in Asia.
At December 2010, US$1,550bn or 67% was
classified as ‘strong’ in line with the end of 2009,
reflecting the continued actions by management to
mitigate the Group’s exposure to credit risk. The
proportion of financial instruments classified as
‘good’ and ‘satisfactory’ were broadly unchanged at
16% and 12% respectively. The proportion of ‘sub-
standard’ financial instruments was 2%.
Loans and advances on which credit quality has
been assessed increased by 8% to US$1,167bn,
driven by growth in commercial and personal
lending in Asia as generally economic conditions
improved, while loans and advances to banks also
rose. The growth was in balances classified as
‘strong’ and ‘good’, while balances classified as
‘sub-standard’ and ‘past due but not impaired’
declined.
Derivative assets on which credit quality has
been assessed grew by 4% to US$261bn from
31 December 2009, with growth in balances being
classified as ‘strong’. The increase was mainly in
interest rate derivatives, reflecting a downward shift
in yield curves.
At 31 December 2010, financial investments
on which credit quality has been assessed increased
by 9% compared with the end of 2009, to
US$393bn. Substantially all this growth was in
assets classified as ‘strong’, reflecting increased
investment of excess liquidity into low-risk
government issued or government guaranteed bonds.